What are the latest trends defining EU road freight operations? Who is transporting what and how far? This Intelligence Briefing breaks down the latest EU road freight data and developments.
Trucks are the backbone of supply chains, transporting 77% of inland freight (road, rail and waterway) in the EU.
This IRU Intelligence Briefing unpacks the EU’s road freight volume trends at both the regional and national levels over the past decade.
Here’s a snippet of what’s covered in each of the Intelligence Briefing's sections:
1. Road freight volumes
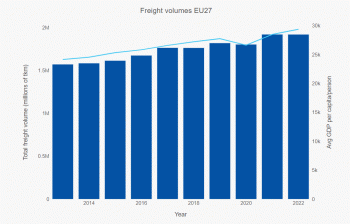
The EU’s road freight volume grew by 22% from 2013 to 2022.

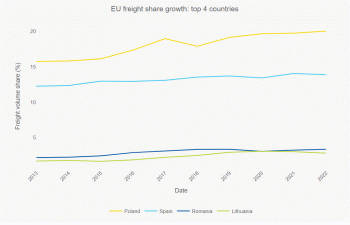
Poland now transports more goods by road than any other EU country, having overtaken Germany in 2017.
Although Germany’s share of freight volume has been declining, it is the only other EU country along with Poland to transport over 15% of total EU goods. Spain and France have also seen their share of road freight volume decrease over time, falling below 10% in 2019.

How have other EU countries’ road freight volume evolved over the past decade?
2. Freight volumes per capita
Lithuania has had the highest road freight volume per capita over the past decade. EU countries with a population between two and three million, such as Lithuania, Slovenia and Latvia, have a high share of road freight per capita.
Which countries make up the top eight?
3. National and international splits
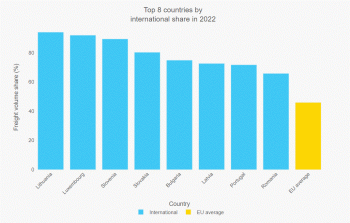
EU road freight operations are mostly national, both today and historically. However, there are some variations among Member States. Some countries, such as Lithuania, Luxembourg and Slovenia, are characterised mainly by international operations.

Which country has a smaller share of international operations, Denmark or Italy?
4. International operations
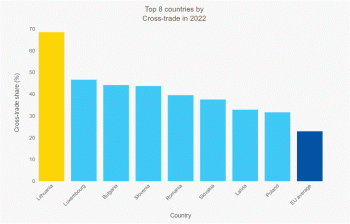
Among the different types of international operations, export figures have, unsurprisingly, the largest share. On the other end, import operations are losing ground to cross-trade and cabotage movements. There are, however, some variations among Member States.

Are Austria and Czechia’s share of cabotage operations higher than the EU average?
5. Freight compositions
Raw materials and intermediate products, the foundations of all products, are among the most transported goods in the EU, so are food and agriculture products. Grouped goods are also among the top categories. But it is mostly due to their definition, i.e. it’s a grouping of goods that are carried together.
What position does “energy” occupy?
6. Freight distances
Road transport’s versatility allows it to cover both long and short distances, from long haul to last-mile deliveries.
When looking at road freight activity in tonnes, what percentage of total goods, by weight, are transported with trips shorter than 150km?
View the IRU Intelligence Briefing “EU road freight trends: Who is driving what, and where?” for a complete overview of the latest road freight transport trends at both the EU and Member State levels.
IRU members can access the briefing via this direct link.
Infographics sources:
1: Eurostat (road_go_ta_tott & sdg_08_10) extracted on 2024-02-23
2: Eurostat (road_go_ta_tott) extracted on 2024-02-23
3: Eurostat (road_go_ta_tott) extracted on 2024-02-23
4: Eurostat (road_go_ta_tott) extracted on 2024-02-23
