2. Diesel production, consumption and imports
Road transport includes numerous vehicle combinations with multiple use cases, utilising various fuels to best meet transport needs. To better understand fuel prices and tolling dynamics, it is helpful to explore the EU context, explaining how, where and how much fuel trucks and buses consume, as well as the tolls they pay. This first chapter provides information on goods and passenger road transport volumes, as well as fleet sizes and compositions.
a) Road freight
The volume of goods transported by trucks has steadily increased over the past decade, peaking at 1.92 trillion tonne-kilometres in 2021. After slipping to 1.86 trillion tonne-kilometres in 2023, volumes increased to 1.87 trillion tonne-kilometres in 2024. This stabilisation demonstrates the sector's resilience, despite inflation and geopolitical uncertainties. It also implies consistent fuel consumption and tolling costs for EU operators.
Figure 1. The EU’s road freight volume increased to 1.87 trillion tonne-kilometres in 2024
EU road freight volume over time (in tkm)
Source: Eurostat (road_go_ta_tott) extracted on 2025-10-09
EU countries have diverse economies and population sizes, creating significant geographical disparities in road freight volumes. At the national level, German and French road freight operations (including transit, loading and unloading) account for almost 25% and 15% of the EU’s total road freight volume, respectively, as shown in Figure 2. This aligns with their GDP rankings. Germany and France make up 23% and 16% of the EU’s GDP, respectively.
Figure 2. Nearly a quarter of all EU road freight was transported to, from or via Germany in 2023
Total road freight volume per country in 2023 (tkm)
Source: Eurostat (road_tert_go) extracted on 2025-10-09
EU road freight volumes are concentrated in five countries, Germany, France, Spain, Poland, and Italy, which together account for around 73% of the bloc’s total road freight volume. The national fleets transporting these goods are also mainly from the same countries, as shown in Figure 3.
Figure 3. The Polish fleet transports a fifth of the EU’s total road freight volume
Total road freight volume per national fleet in 2024 (tkm)
Source: Eurostat (road_go_ta_tott) extracted on 2025-10-09
For a more detailed breakdown of EU road freight volumes and its future trends, consult the Intelligence Briefing titled the breakdown of the latest road freight volumes, which also provides a forecast to 2030.
b) Passenger transport
Bus and coach transport, which represents about 8% of total EU inland passenger transport, plays a key role in providing affordable and collective mobility options across the EU (in 2023). The sector’s passenger volume dropped sharply in 2020 due to the Covid-19 pandemic. In 2023, it rebounded to 428.1 billion passenger-kilometres. While it remains below pre-pandemic levels (484.5 billion passenger-kilometres in 2019), it represents a strong recovery trend. Push and pull measures to incentivise a modal shift from private cars, such as by lowering ticket prices, could also explain such a rapid recovery.
Figure 4. The EU’s total bus and coach transport volume rose by 47% between 2020 and 2023, but it is still below pre-pandemic levels
EU bus and coach transport volume (pkm)
Source: European Commission (Statistical Pocketbook 2025) extracted on 2025-10-09
When examining the distribution of EU road passenger volumes by fleet, the same countries as in road freight dominate, though in a different order. Italy leads at 19%, followed by France at 12.4% and Germany at 11.7%, aligned with their economic and population sizes.
For a more detailed breakdown, consult the Intelligence Briefing on passenger transport in the EU.
Figure 5. In 2023, Italy accounted for 19% of the EU’s total bus and coach volume
EU bus and coach volume per national fleet in 2023 (pkm)
Source: European Commission (Statistical Pocketbook 2025) extracted on 2025-10-09
Compared to road freight, passenger transport is more geographically dispersed across the EU. Beyond the five major passenger countries, Romania and Greece also maintain significant passenger-kilometre volumes, illustrating a wider spread of road passenger activity throughout the EU.
Although there are now several heavy-duty vehicle powertrain technologies, the internal combustion engine running on diesel remains the predominant one across the industry. Diesel powered 99% of registered trucks and 93% of registered buses in 2024.
Alternative to diesel (alternative fuels) emerged this last decade to reduce carbon emissions, inherent to diesel combustion. Transport operators, vehicle manufacturers and shippers have internal and external objectives linked to greenhouse gases reduction, creating a growing momentum on alternative powered trucks and buses new registrations.
The EU’s current fleet now includes six different powertrains:
Figures 6 and 7 illustrate the total number of trucks and buses over the past decade in the EU. The truck fleet reached 6.21 million vehicles in 2024, while buses and coaches totalled 740,000.
Figure 6. The EU truck fleet has grown by 18% over the past decade
Total number of trucks in the EU
Figure 7. In 2023, the total number of buses reached nearly 740,000, representing a 4.6% increase since 2014
Total number of buses in the EU
Source: IRU estimates for 2024 & Eurostat (road_eqs_busveh) & (road_eqs_lorroa) extracted on 2025-10-09
In 2024, of the small but growing number of alternative fuel vehicles on EU roads (1% of trucks, 7% of buses and coaches), CNG trucks and buses were most widely used (48% of the EU alternative fleet), followed by battery-electric vehicles (BEVs) at 32%. The number of BEVs rose by 381% between 2020 and 2024 (from 8,082 to 38,906).
Although registrations of CNG-fuelled vehicles rebounded in 2023, particularly due to new registrations in France, their sales slowed in 2024. They have now fallen behind BEV registrations for both trucks and buses. In recent years, electric trucks and buses have emerged as strong alternatives for the sector, registering approximately 10,000 in 2023 and 14,000 in 2024.
LPG ranks as the third most common alternative fuel vehicle in the EU, with 11,119 trucks and buses in 2024, followed closely by LNG vehicles (10,800). However, LPG vehicles are gradually declining (13% decline from 2022 to 2023), primarily because governments no longer view LPG as a viable decarbonisation solution due to its high emission profile. As a result, many countries have reduced their LPG subsidies (such as tax breaks).
Figure 8. The EU’s alternative vehicle fleet has consistently grown over the past decade
Evolution of alternative truck and bus fleet in EU
Figure 9. The number of newly registered alternative fuel trucks and buses increased by 50% in 2023 compared with 2022
Evolution of alternative truck and bus registrations in EU
Source:
European Alternative Fuels Observatory
extracted on 2025-10-09.
Please note: Some historical data in EAFO has been updated in 2025. As a result, some alternative vehicle figures may differ from those presented in previous IRU publications
OEMs’ introduction of new vehicles with longer ranges, along with recent regulatory changes, is encouraging the adoption of low- and zero-emission vehicles. The IRU Green Compact Report Survey explores in more detail the international decarbonisation regulatory approach and the benefits of efficient technologies to lower emissions.
Recent registration data echo previous figures, with a sharp increase in the alternative fuel fleet. This growth was driven by a surge in CNG and BEV truck and bus registrations in 2023. BEVs have now taken the lead. By the end of 2025, new BEV truck registrations may exceed those of CNG and LNG combined.
Nearly 19,000 heavy-duty vehicles were registered across Germany, France, Poland, Spain and Italy, representing 74% of the EU’s total alternative fuel vehicle registrations, in 2024. However, there are significant differences in their compositions.
Source: European Alternative Fuels Observatory extracted on 2025-10-09.
In 2024, there were 85,614 heavy-duty alternative fuel vehicles across Germany, Poland, Spain, France and Italy, making up 70% of the EU’s total alternative fleet.
Figure 10. France has the largest alternative fleet with 25,000 trucks and buses, 80% of which were CNG vehicles
Distribution of alternative fuel truck and bus fleet by country in 2024
Source: European Alternative Fuels Observatory extracted on 2025-10-09.
The French alternative fuel fleet consists primarily of CNG vehicles, with electric vehicles gaining significant momentum since 2022. This growth has been driven mainly by France's low electricity prices (see electricity price section below) and national purchase subsidies, as detailed in IRU's Intelligence Monitoring on zero-emission vehicle incentives worldwide.
The Italian alternative vehicle fleet consists primarily of CNG and LNG trucks (60% and 24%, respectively). This preference stems from their relatively lower prices at the pump (see CNG prices section below), robust refuelling infrastructure, and the presence of a local manufacturer in IRU member IVECO which produces the most extensive range of natural gas-powered trucks and buses. Spain's fleet composition closely resembles that of Italy's, with CNG and LNG vehicles dominating, largely due to their more affordable fuel prices.
The Polish alternative fuel vehicle fleet is heavily reliant on LPG powertrains, which account for 75% of its non-diesel vehicles. This is mainly due to lower prices at the pump than diesel a strong refuelling infrastructure, and a well-developed retrofit network that makes gas powertrain vehicles compatible with LPG. However, the registration of new LPG vehicles has ceased. The Polish fleet is shifting towards CNG and BEV, although adoption remains limited.
The German fleet features various alternative fuel vehicles, 71% of which are BEVs. This is primarily thanks to previous government subsidies for zero-emission vehicles (ZEVs) which have been phased out.
As previously highlighted, diesel remains the preferred energy source for EU transport operators (70 billion litres annually). Understanding diesel's supply chain and price dynamics is essential for transport operators and shippers to better forecast their potential impact on freight rates.
Diesel is refined from crude oil, a natural petroleum extracted from the earth's crust. Oil-producing countries typically export crude oil to refineries for processing. The crude oil market is highly concentrated. Russia, Saudi Arabia and the US together accounted for around 43% of global oil production in 2024.
Figure 11. US oil production is nearly double that of Russia and Saudi Arabia
Daily crude oil production in 2024 (barrel)
Source: Energy Institute (Statistical Review of World Energy 2024) extracted on 2025-10-09
The EU, which produces only 0.3% of global oil, relies on imports to meet its diesel demand. OPEC countries (Algeria, Congo, Equatorial Guinea, Gabon, Iran, Iraq, Kuwait, Libya, Nigeria, Saudi Arabia, the United Arab Emirates and Venezuela) remain the largest source of crude oil imports into the EU, reaching 123.46 million tonnes in 2024, an 8% drop compared to 2023. The US (15%) and Norway (14%) continue to be the second- and third-largest suppliers, while Brazil has strengthened its position as an emerging supplier (5%). Russian imports ceased in 2023 following EU sanctions imposed in response to the war in Ukraine. This represented a significant disruption to the supply chain, which the EU has addressed by increasing imports from the US, Norway and Brazil.
Figure 12. The EU imports a quarter of its oil from OPEC countries
EU crude oil imports by origin
Source: Eurostat (nrg_ti_oilm) extracted on 2025-10-09
Crude oil is refined to remove impurities and to separate its components, creating a large range of products, including diesel suitable for road transport.
Europe accounts for 14% of global crude oil refining capacity, according to the Energy Institute, ranking behind Asia Pacific (36%) and North America (21%). At the end of 2024, the EU had 66 mainstream refineries converting imported crude oil into diesel. This represents a slight year-on-year decrease, with one less refinery compared to the previous year, due to the conversion of ENI’s Livorno refinery in Italy from refining diesel to producing biofuel. ENI is Italy’s leading energy company and has been actively transitioning some of its assets to support low-carbon energy solutions.
Germany has the highest concentration of refineries (11) in the EU, followed by Italy (9) and Spain (8). Of the 27 EU countries, 21 have at least one refinery. Cyprus, Estonia, Ireland, Luxembourg, Malta and Slovenia are the six countries without a refinery. However, as Figure 13 demonstrates, having refineries does not always guarantee diesel self-sufficiency.
Figure 13. Germany, France, Poland, Spain and Italy produce 54% of the EU’s diesel and consume 65% of it
Diesel production, consumption and imports by country in 2024
Source: Eurostat
(nrg_cb_oil)
extracted on 2025-10-09
Please note: IRU estimates for local consumption. Finland is missing data for imports and is excluded from EU average
National diesel production does not align with national consumption. Some countries, such as the Netherlands, produce significantly more diesel than they consume (nearly 3.5 times more than they consume). Others like France rely on imports (17% of EU imports, the highest in the bloc). The local consumption of some countries is below their combined imports and production, as they may be refilling strategic reserves, anticipating demand that has not yet materialised, or taking advantage of price differences between delayed exports and imports.
Germany and Italy are the largest producers of diesel at 19% and 15%, respectively. The Netherlands produces 9% of all EU diesel, despite having relatively low domestic demand (only 2% of EU consumption). Combined with a high import volume (10% of EU imports), these surplus positions the Netherlands as a key diesel exporter. The strategic location and extensive capacity of the Port of Rotterdam further reinforce the country’s role as a key hub for diesel distribution.
For more detailed information on the types of goods traded and transported by road across the EU, consult the IRU Intelligence Briefing titled The dynamics of road transport: what’s moving across the EU.
Spain consumed 21.1 million tonnes of diesel in 2024, which is seven times the amount it produced (2.96 million tonnes). However, Spain imports a relatively limited amount of diesel (5.9 million tonnes). It also produces only a moderate amount of diesel. A closer look at the data reveals that inter-product transfers play a key role in meeting Spain's diesel demand, with 17 million tonnes recorded in 2023 (latest available data). These transfers involve the reclassification of petroleum products when their quality changes, resulting in movements between product categories. This mechanism effectively balances supply by reallocating refined outputs.
The EU relies on imports to supplement its domestic diesel production and meet demand. Figure 14 illustrates the distribution of its imports by country of origin.
Figure 14. In 2024, nearly a quarter of EU diesel came from OPEC countries and the US
EU diesel imports by origin
Source: Eurostat (nrg_ti_oilm) extracted on 2025-10-09
Most EU countries import diesel from other EU countries. Between 2022 and 2023, EU-sourced imports jumped from 51% to 60%, indicating growing domestic production capacity. This shift demonstrates progress towards greater energy independence as the EU enhances its ability to meet its internal road diesel demand.
Figure 15 shows EU diesel consumption (for cars, vans, buses, trucks and construction equipment) compared to domestic refinery output. Despite the increase in intra-EU imports in recent years, the gap between domestic consumption and production widened slightly from 2020 to 2023. This trend indicates a redistribution of diesel within the EU to meet regional needs, highlighting the bloc’s growing reliance on its own refining and distribution network. Interestingly, the surge in freight activity post-Covid-19, reaching a record of 1.93 tonne-kilometres in 2021, did not result in a similar peak in diesel consumption.
Figure 15. EU diesel demand has been above its domestic production over the past decade
EU diesel consumption and production
Source: Eurostat
(nrg_cb_oilm)
extracted on 2025-10-09
Please note: IRU estimates for local consumption for 2024.
This section examines diesel prices, beginning with an EU-level overview, before exploring the key factors behind price fluctuations.
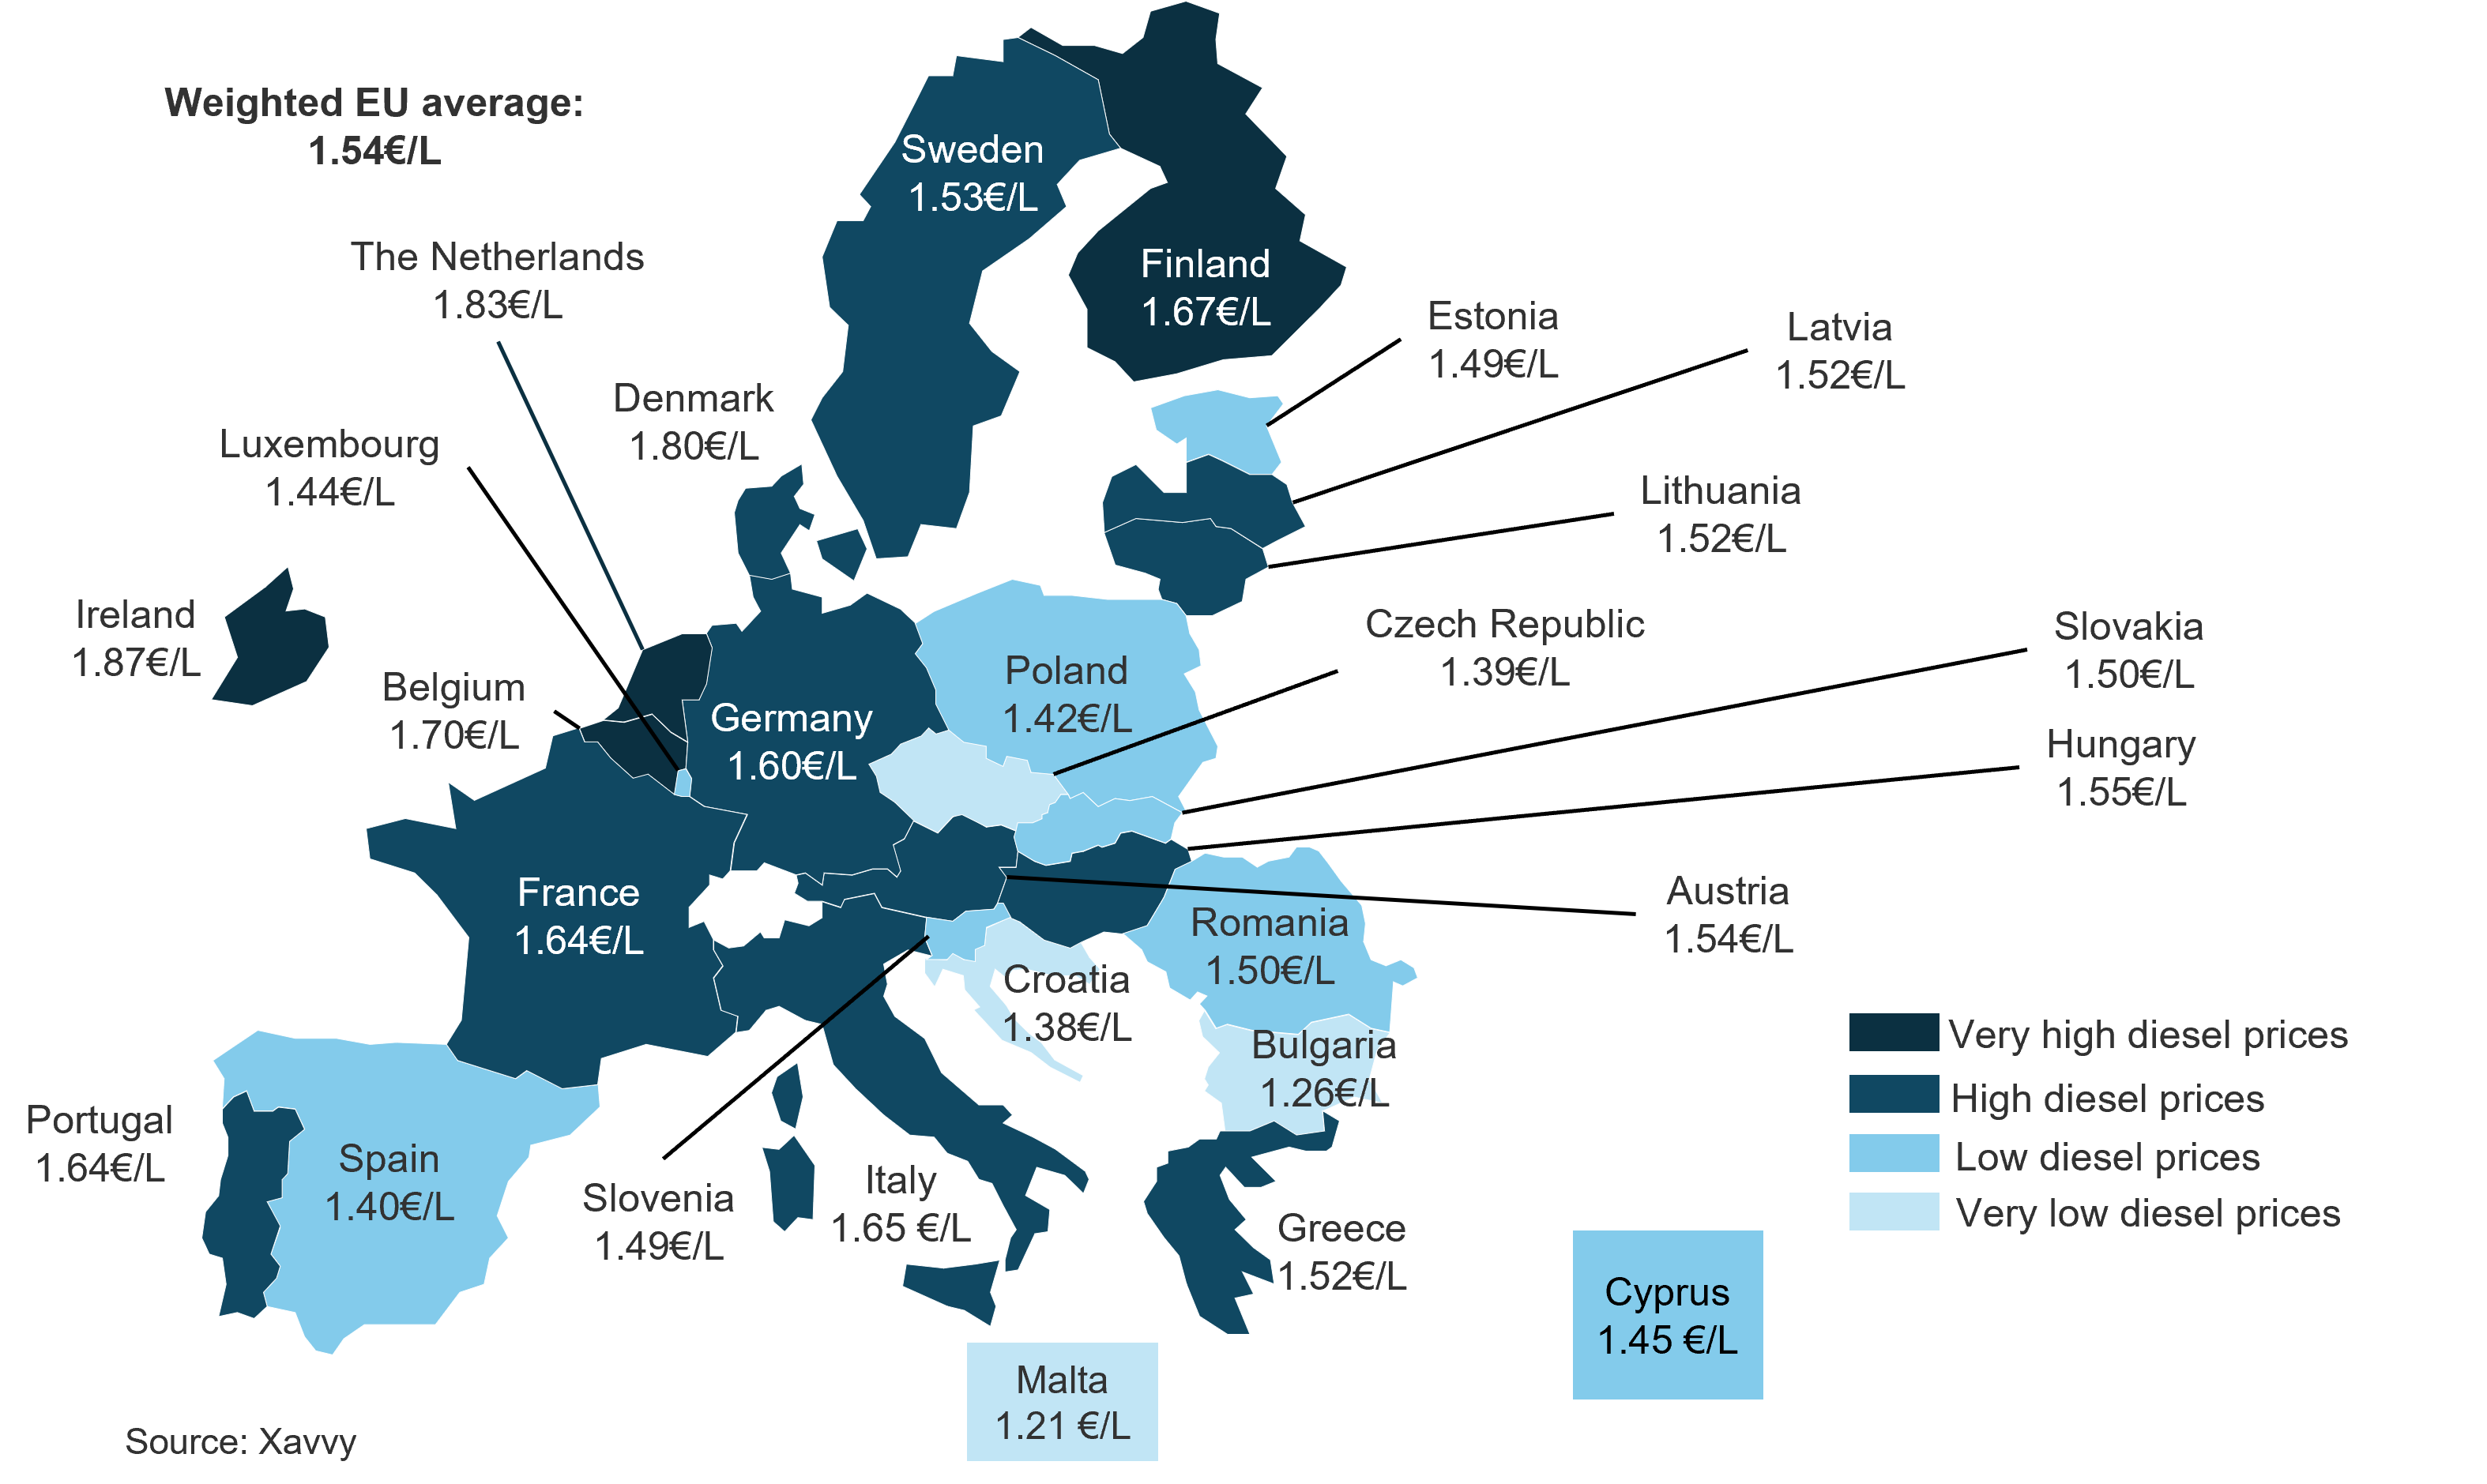
As shown in Figure 16, diesel prices vary significantly across the EU, ranging from EUR 1.21 per litre to EUR 1.87 per litre in August 2025. Western EU countries tend to have higher prices, despite having more production sites. For example, the Netherlands produces more diesel from its five refineries than it consumes. Nevertheless, it has the second-highest diesel price at the pump in the EU. Local excise taxes explain this dynamic (EUR 0.52 per litre), as they significantly increase the final price of diesel beyond its production cost. These taxes are a source of revenue for governments and are designed to encourage more energy-efficient behaviour, discouraging excessive fuel consumption through economic incentives.
Figure 16. EU weighted average diesel price was 2.6% lower year on year in August 2025
Diesel prices at pump (August 2025)
Interestingly, national fleets conducting 90% or more of their freight operations internationally tend to benefit from some of the lowest diesel prices in the EU. For example, fuel prices in Poland, Spain and Lithuania are below those in Germany and France, giving their transport operators a competitive advantage. As a countermeasure, some countries such as France provide partial excise duty exemptions to domestic operators. These exemptions help bring diesel costs closer to those of lower-price countries, balancing the TCO.
Figure 17. The EU weighted average diesel price at the pump has fallen by 22% since 2022
EU weighted average diesel price at the pump
Source: European Commission (Weekly oil bulletin) extracted on 2025-10-09
Historically, diesel prices have varied significantly over time. Adjusted for inflation, diesel prices are lower now than in 2014, despite a significant spike in 2022. As diesel is made of crude oil, which is only produced in a handful of countries, its supply chain is highly sensitive to the geopolitical context.
In late 2014, crude oil prices started to plunge due to rising production in the US. Crude oil prices hit their lowest point during the pandemic (USD 20.4 per barrel in Italy) due to low demand. Prices then started to rebound in 2020. In Germany, crude oil prices jumped from USD 20.59 in May 2020 per barrel to a peak of USD 115.2 in June 2022. This recovery aligns with the resurgence in freight volumes observed during that same period. It also coincides with the war in Ukraine, which triggered EU sanctions on Russian oil and disrupted the supply-demand balance. More recently, instability in the Red Sea has further increased prices, while US preference for the dollar over the euro has exerted downward pressure on prices. Understanding these price variations requires high-frequency monitoring. IRU organises a quarterly webinar to assess evolving market conditions. Past webinars are available on the Intelligence Platform.
Finally, although diesel prices show greater variation, they are closely linked to inflation. Figure 18 illustrates fuel price and overall inflation trends in the EU since 2015, highlighting how increases in diesel prices have contributed to higher inflation across goods. Higher diesel prices directly increase transport costs. As highlighted in IRU Intelligence Briefing: The dynamics of road transport: what’s moving across the EU, in 2023, road transport moved EUR 1.1 trillion worth of goods in the EU, accounting for around 22% of the bloc’s overall trade volume (EUR 5.1 trillion). Consequently, fluctuations in diesel prices can significantly influence final consumer prices.
Figure 18. The price of diesel and overall inflation have increased by 18% and 19%, respectively, in the EU since 2021
Diesel price and overall inflation in EU
Source: European Commission (Weekly oil bulletin) & Eurosat (prc_hicp_aind) extracted on 2025-10-09
The price of diesel is closely tied to that of crude oil. However, pricing differences among EU countries can also be explained by the other components making up the final price of diesel. At the pump, the key components behind the price of diesel are:
Crude oil prices are generally given in monetary value per barrel. Each barrel contains approximately 160 litres. From a single barrel, a refinery extracts mostly gasoline (around 43%), diesel (23%) and other products (23%). Therefore, a barrel of crude oil yields approximately 40 litres of diesel. Assuming the barrel’s value is distributed equally among its refined outputs, based on volume, diesel accounts for approximately 23% of the crude oil value. Using this method, Figure 19 shows the average monthly price of a barrel of crude oil imported into the EU. The average monthly price of imported diesel is shown in Figure 20 (Note: Proportions vary by refinery, with some extracting up to 40% diesel).
Figure 19. Average monthly price of imported crude oil fell by 40% between 2022 and 2025
Average monthly price per barrel of crude oil imported
Figure 20. Over the past decade, the average price of EU raw diesel has fluctuated between EUR 0.12 to 0.88 per litre
Average monthly price of imported diesel
Source: IRU estimates & Eurostat
(nrg_ti_coifpm)
extracted on 2025-10-09
Data is missing for Poland (from 2020 onwards due to confidentiality) and for Spain (from Sep 2024 onwards).
Figure 21. In 2024, EU average raw diesel costs represented 34% of the total price at the pump
Average monthly price for imported diesel and its price at pump
Source: IRU estimates
& Eurostat
(nrg_ti_coifpm)
& European Commission
(Weekly oil bulletin)
extracted on 2025-10-09
Please note that diesel raw prices are missing in between 10-2022 and 07-2024.
As shown in figures 19 to 21, the cost of crude oil is the primary component of diesel’s final price. EU countries tend to follow similar trends in raw material pricing, as they deal with the same global crude oil markets. However, differences emerge in the additional cost layers, particularly in taxation, refining and distribution.
Once a barrel of crude oil has been purchased, it needs to be transported to a refinery from extraction of the different chemicals, including diesel, before delivering the diesel to a public fuel station or a transport operator’s own diesel tank. The cost of transport and refining is then added to the crude oil price to obtain the price of diesel before taxes. There is no data to compare EU countries. However, France shares such data on its own refineries (i.e. France’s six refineries, out of the 66 in the EU), offering a glimpse into such prices.
Figure 22. Between 2022 and 2024, refining cost for diesel fell by 55%
Refining cost for diesel in France
Source: French Ministère de la transition écologique et de la cohesion des territoires extracted on 2025-10-09
Refining costs saw a significant price hike in 2022 due to the war in Ukraine, which triggered an energy crisis in Europe. Energy demand now exceeds supply. Since then, this cost component has been approaching the usual levels seen over the past decade, ranging from EUR 0.10 to 0.60 per litre. In France, refining costs accounted for approximately a third of the final diesel price at the pump in June 2024, when compared to the average refining costs for that year.
Figure 23. In 2024, diesel’s distribution cost reached EUR 0.21 per litre, up by 133% since 2015
Distribution cost for diesel in France
Source: French Ministère de la transition écologique et de la cohesion des territoires extracted on 2025-10-09
In contrast, distribution costs increased significantly until 2023 in France. The value of this component more than doubled in nearly ten years. In 2024, the distribution cost was 0.21 EUR per litre, accounting for approximately 10% of the final price of diesel.
This spike in the distribution cost coincides with higher freight rates driven by inflation and a potential lack of transport capacity linked to the driver shortage. Environmental taxes (i.e. energy certificates and taxation schemes favouring the use of renewable energy in transport) also contribute to upwards pressure. Additionally, French stakeholders are facing increased costs with more stringent national directives, including strategic stock management requirements.
Finally, different taxes apply to diesel, the main one being excise tax (also called excise duty) and VAT.
Excise taxes are indirect taxes on the sale or use of alcohol, tobacco and energy. They are calculated based on the quantity of fuel purchased, not their value. The entire revenue generated from excise taxes goes to the country where they are paid. EU legislation sets harmonised minimum rates (i.e. EUR 0.33 per litre). The Energy Taxation Directive establishes the minimum excise duty rate that EU countries must apply to fuel for transport services and electricity. But EU countries are free to apply excise duty rates above these minimums, according to their own national needs. The following chart provides an overview of the current diesel excise rates by country, ranging from EUR 0.33 per litre in Bulgaria to EUR 0.63 per litre in Italy.
Figure 24. The average EU excise tax is EUR 0.45 per litre
Diesel excise duties by country as of August 2025
Source: European Commission (Weekly oil bulletin) extracted on 2025-10-09
A few EU countries offer excise duty rebates to transport operators, typically under specific conditions, such as the use of trucks with a GVW exceeding 7.5 tonnes. These countries include Belgium, Croatia, France, Hungary, Italy, Portugal, Romania, Slovenia, and Spain, each applying different rebate levels. For instance, France provides a rebate of approximately EUR 0.15 per litre, reducing its excise tax for eligible operators to EUR 0.45 per litre. Spain, Croatia, Slovenia and Portugal apply rebates to lower the excise duty to the EU minimum of EUR 0.33 per litre.
Another major tax applied to diesel prices is the value-added tax, or VAT. The EU has set a minimum limit for its Member States at 15%. However, there is no maximum. At the date of publication, the minimum VAT rate is 17% (Luxembourg), while the maximum rate is 27% (Hungary). Nevertheless, operators can recover partially or fully the VAT applied to diesel according to the local regulation.
Figure 25. The average VAT rate in the EU is 22%
VAT rates by country as of August 2025
Source: European Commission (Vat rates) extracted on 2025-10-09
Finally, other indirect costs may apply, depending on the country. For instance, Austria and Germany both apply a carbon tax of EUR 55 per tonne of CO₂ on fossil fuels, resulting in an additional cost for diesel. Figure 26 shows the overall breakdown of diesel prices per country, outlining the weight of taxes on the final price of diesel.
Figure 26. On average across the EU, taxes account for around half of the diesel price
EU diesel price breakdown in August 2025
Source: European Commission (Weekly oil bulletin) & xavvy extracted on 2025-10-09
Based on the latest data from August 2025, excise duty accounts for the largest share of the final price at the pump in Italy (39%), followed closely by Malta (39%) and France (38%). In contrast, VAT accounts for a significant part of diesel prices in Hungary (27%), Denmark (25%) and Sweden (25%). Overall, Italy has the highest total tax share on diesel (61%), while Estonia has the lowest (45%).
When comparing the price of diesel among the five leading EU road transport countries, Poland has the lowest price, due to low taxes and crude oil prices, followed by Spain, Germany, France and Italy. These differences highlight how national tax structures, whether weighted more towards excise duties or VAT, can influence diesel prices across Europe.
According to the IRU Green Compact Survey Report 2025, including its modelling analysis to decarbonise the sector, the most practical path forward combines smarter efficiency with a shift to alternative fuels. HVO and electricity are the two alternative fuels available for road transport which are gaining momentum in the EU.
HVO, also referred to as renewable diesel, is a type of biofuel made by turning vegetable oils into a cleaner-burning fuel through a chemical process that uses hydrogen and a catalyst. Vegetable oils used for HVO production can originate from various sources such as rapeseed, palm oil and waste (e.g. cooking oil and animal fat). As a result, its carbon intensity is 90% lower than diesel, on average, in the EU, based on a well-to-wheel approach.
Compared with diesel, other advantages of HVO include less tailpipe pollutants (i.e. better trade-off between particulate matter and nitrogen oxides) and compatibility with a modern diesel engine. Its disadvantages include a higher price at the pump and more limited availability, with disparities in the density of HVO refuelling stations within the EU. HVO can be used either in pure form (HVO or HVO100) or blended with diesel in a proportion based on its volume (HVO30, or 30% V/V blend with diesel), without modifying a diesel engine. It should also be noted that HVO is not the only biofuel available on the market. There is also FAME, which is often blended with diesel to meet B7 requirements (7% V/V blend).
Figure 27. Spain has the lowest HVO price at the pump
HVO prices at pump (August 2025)
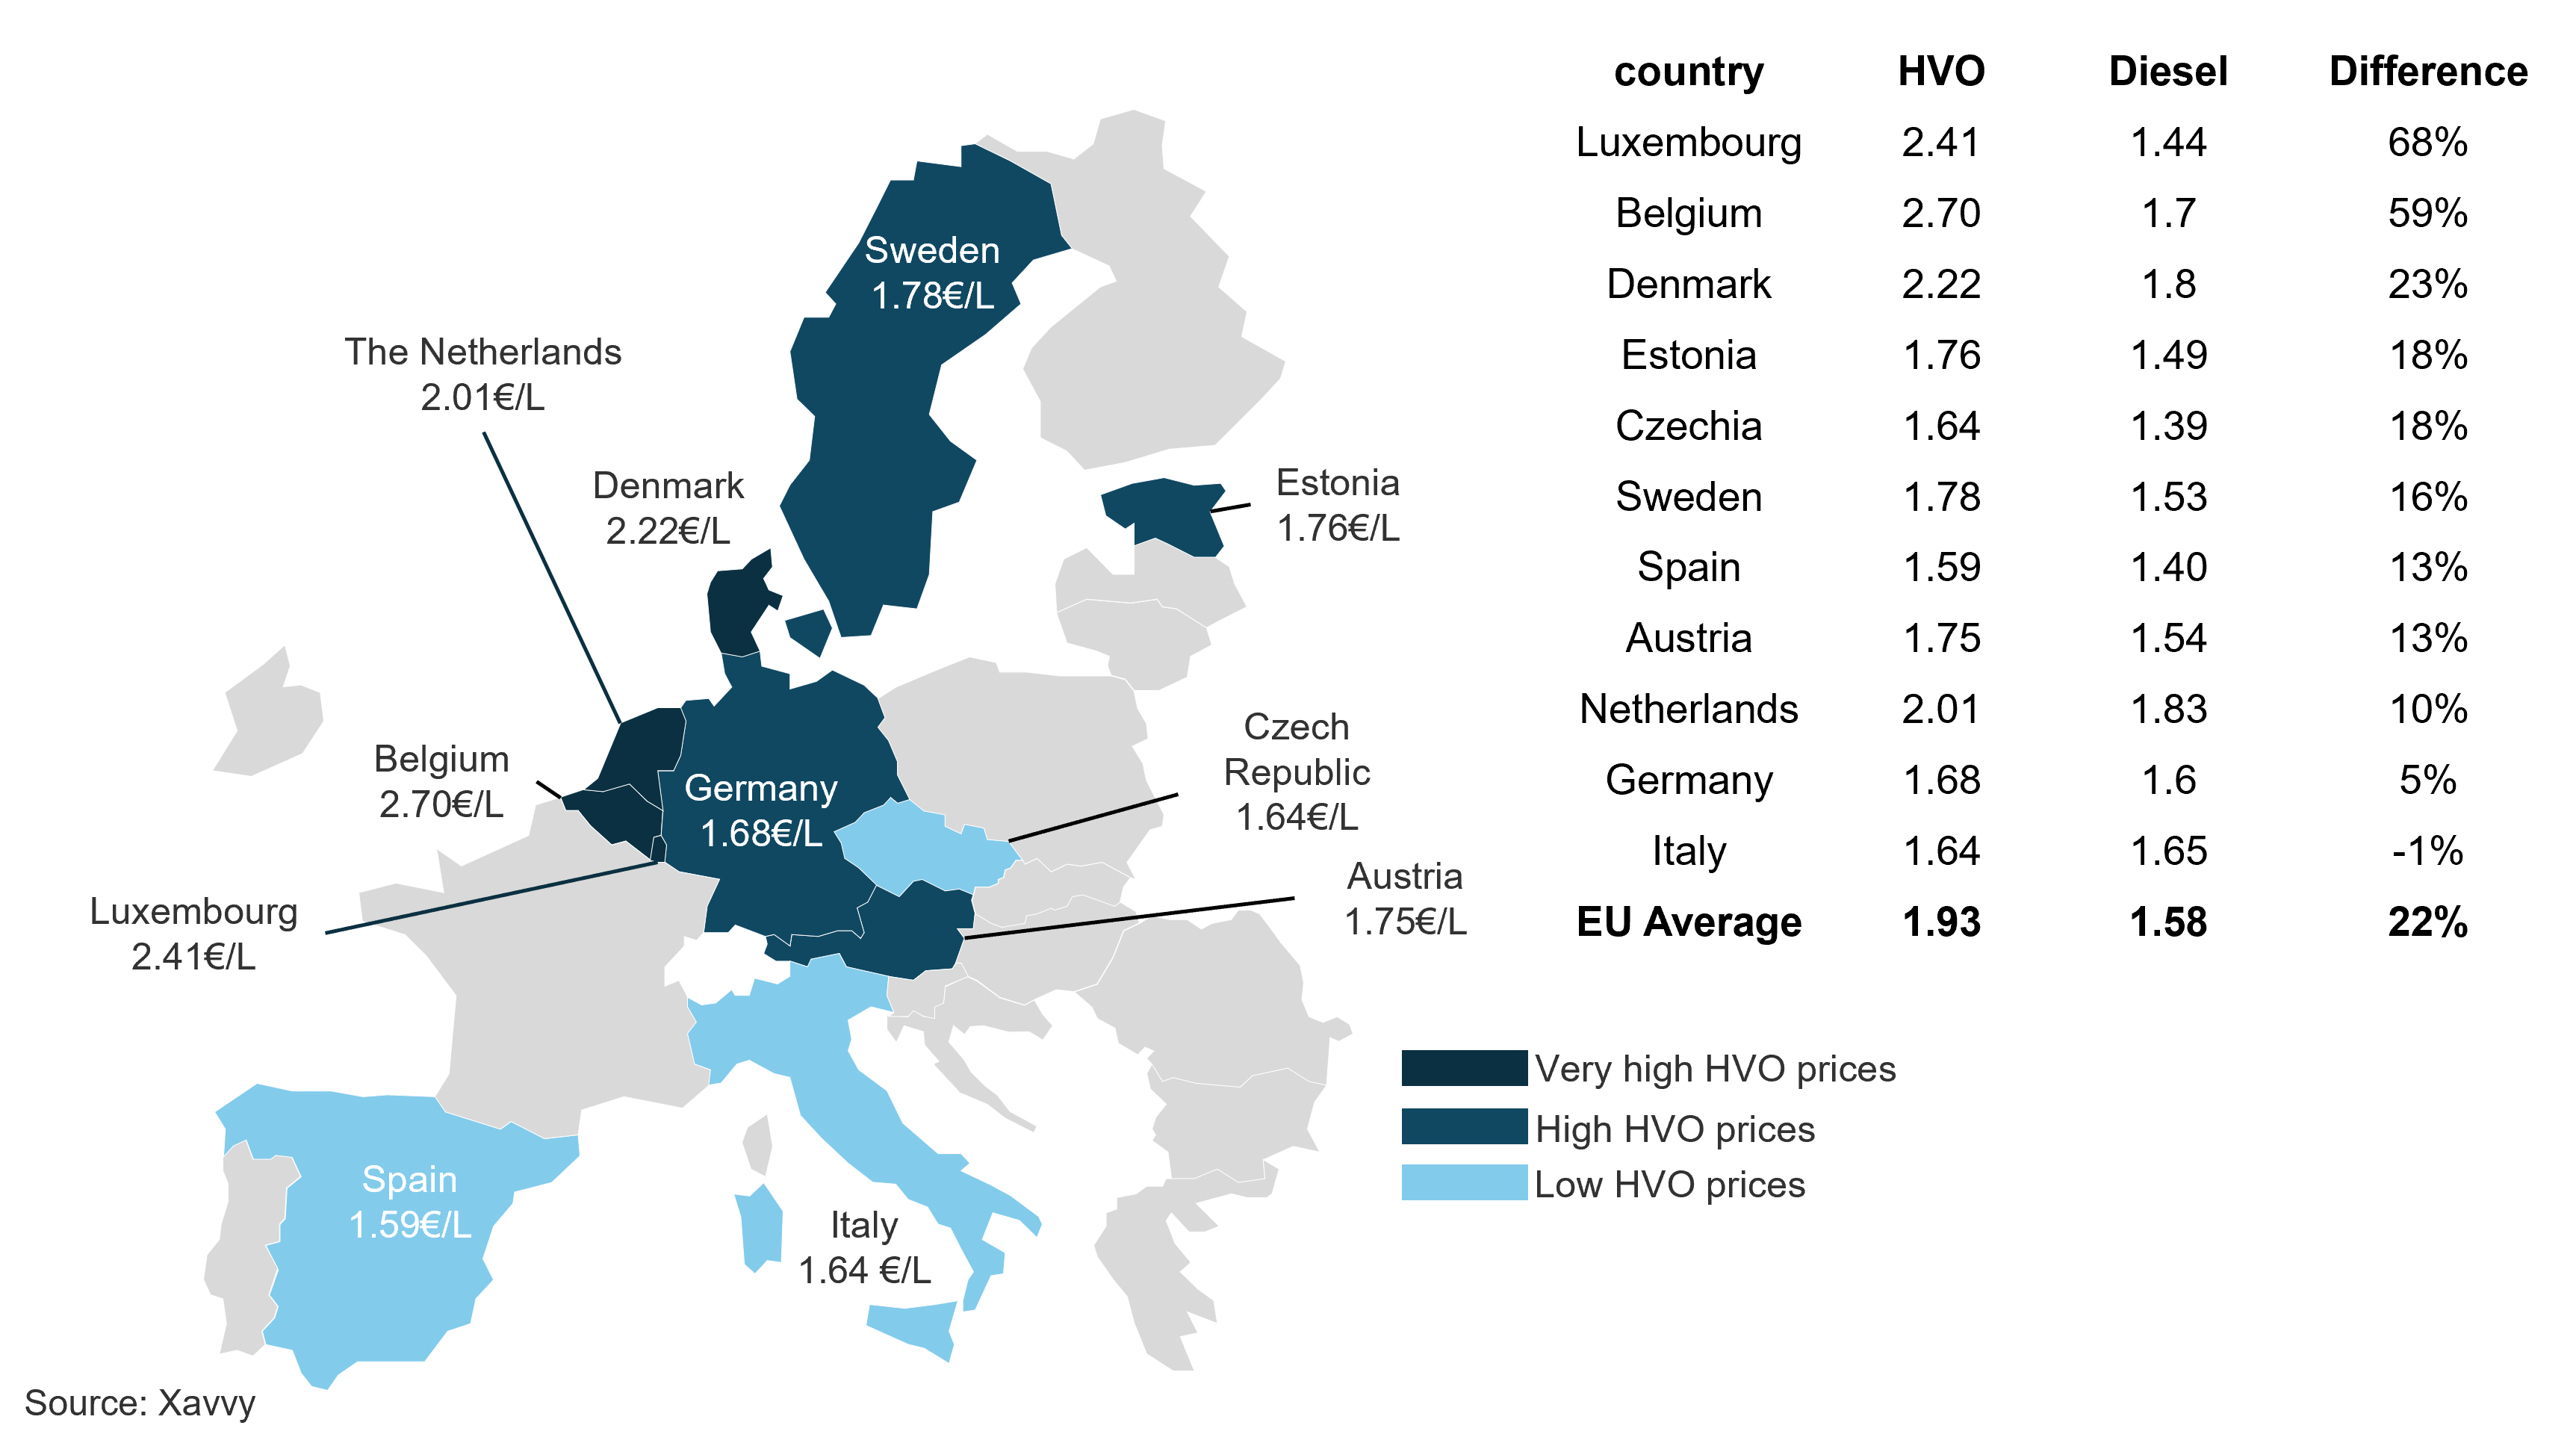
Compared with diesel, HVO is 22% more expensive on average (i.e. EU average based only on Austria, Belgium, Czechia, Denmark, Estonia, Germany, Luxembourg, Italy, the Netherlands, Spain and Sweden). Interestingly, Italian HVO prices (EUR 1.64 per litre) were generally lower than diesel (EUR 1.65 per litre) in 2024, which could be explained by the presence of its three large production sites. Another price difference explainer is the national approach to taxation, with some countries offering lower excise duties for biofuels.
Several generations of exhaust regulations have reduced the maximum allowable quantity of pollutants emitted from truck and bus exhaust pipes. With EURO VI, these regulations apply to all new trucks sold in the EU, limiting vehicles’ emissions of carbon monoxide, hydrocarbons, particulate matter, and nitrogen oxides.
The selective catalytic reduction (SCR) system addresses the release of nitrogen oxide resulting from the chemical reaction between nitrogen and oxygen at high combustion temperatures. SCR injects AdBlue into the exhaust system to transform nitrogen oxides into nitrogen and water molecules. The consumption of AdBlue is proportional to the consumption of diesel, with AdBlue consumption making up about 5% of diesel consumption by volume. While there is no data on the amount of AdBlue consumed by trucks and buses in the EU, it can be approximated from the 70 billion litres of diesel consumed yearly, given an AdBlue yearly consumption of 3.5 billion litres. (Note that engines running on HVO also use AdBlue to comply with EURO VI.)
AdBlue is made by mixing urea with demineralised water. Demineralised water does not contain mineral salts. The water is boiled, and the resulting vapor is condensed. The production of urea is more complex. To produce urea, ammonia and carbon dioxide are combined via the Haber-Bosch process. Generally, the same factory produces ammonia and carbon dioxide. Ammonia is produced from hydrogen, which derives from natural gas. Transforming natural gas into hydrogen also creates carbon dioxide, which is collected and reused to produce urea. Urea takes the form of granules or liquid, which are then mixed with demineralised water to make AdBlue.
Since AdBlue is mostly produced from natural gas, its price is closely tied to natural gas prices, which soared in 2022, linked to the war in Ukraine. Prices have normalised since then. Price hikes are now in line with inflation. AdBlue prices are largely determined by distribution costs, since the raw materials consist mainly of demineralised water. Some producers indicate that it represents more than 50% of the final product cost (pre-2022).
Figure 28. In Poland, AdBlue hit a record price of EUR 1.71 per litre in 2023, before dropping to EUR 0.81 in 2025
AdBlue prices at pump
Based on xavvy
extracted on 2025-10-09
Note that Figure 28 shows the price at the pump. AdBlue can also be purchased in large canisters at fuel stations, although at much higher prices – over EUR 3 per litre.
CNG-powered trucks and buses are the second most-used engine option after diesel in the EU, representing 59% of the alternative fleet in 2024. CNG-fuelled vehicles have grown in popularity as their engine power and torque levels are comparable to diesel engines, especially since 2014 and the introduction of more powerful gas engines on the market.
Source: European Alternative Fuels Observatory extracted on 2025-10-09
CNG is a derivative of natural gas, stored on board in cylinders at pressures between 200 and 250 bars. Most natural gas used in the EU is imported, as shown in figures 29 and 30.
Figure 29. By 2023, the share of imported natural gas from the EU had grown to 17%, compared to 11% in 2020
EU natural gas imports by partner
Figure 30. One fifth of EU natural gas imports came from Norway in 2023
EU natural gas imports per partner
Source: Eurostat (nrg_ti_gas) extracted on 2025-10-09
While 2024 data is not yet available, they are expected to be close to the previous year. In 2023, the EU’s top three natural gas suppliers were Norway (22%), domestic EU production (17%) and the US (16%). EU production increased from 7% in 2022 to 17% in 2023. Russian gas imports are continuing their steep decline since the start of the war in Ukraine. Russia is now the smallest supplier (10% in 2023). This shift has opened the door for other producers. The US has quadrupled its share over the past five years (from 3% in 2019 to 16% in 2023).
Like diesel, the price of natural gas at the point of sale is composed of several key components, including:
Starting with the cost of the raw material, Figure 31 shows the evolution of pre-tax EU natural gas prices in euros per kilogram since 2017.
Figure 31. Since 2022, declining pre-tax natural gas costs appear to be connected to weaker demand during milder winters
EU natural gas price pre-tax
Source: Eurostat (nrg_pc_203_c) extracted on 2025-10-09
The pre-tax price of natural gas is highly volatile in the EU, nearly quadrupling from EUR 0.22 per kilogram in 2020 to EUR 0.85 per kilogram in 2022. Since 2022, pre-tax natural gas prices have declined, reaching EUR 0.55 per kg in 2024. Nevertheless, they are still higher than pre-2022 levels, even when adjusted for inflation. These fluctuations are partly due to warmer temperatures, geopolitical tensions, and import distributions.
Looking now at the full breakdown of natural gas available for consumption, the next figures cover all EU countries. Sweden has the highest natural gas price, due to more expensive raw material and high taxation levels, about 38% of the final price.
Figure 32. Compared to most EU countries, natural gas is nearly two times more expensive in Sweden
Natural gas price breakdown by component in 2024
Source: Eurostat
(nrg_pc_203_c)
extracted on 2025-10-09
Note: Energy and supply is a sum of ”energy and supply” and ”other” components (data for Sweden is from 2023, 2024 data is missing)
Natural gas is taxed differently according to each EU country’s own regulations, within the Energy Taxation Directive framework. Among the top five largest road transport markets, Italy has the lowest natural gas tax (15%), but it has a relatively high network cost (18%). Network costs are related to the transmission and distribution of natural gas.
The environmental tax relates to air quality and other environmental purposes, as well as taxes on CO₂ emissions and other greenhouse gases. This component also includes excise duties. Nordic countries (i.e. Sweden, Finland, Denmark, Norway) and the Netherlands have some of the highest environmental tax rates in the EU. This reflects national efforts to incentivise a shift away from natural gas from end consumers, not only transport operators.
Some countries apply a renewable tax aimed at funding alternative cleaner energy such as solar and wind, and promoting energy efficiency, combined heat and power generation. In 2024, Slovenia had the highest renewable tax rate (2%) in the EU.
The capacity tax covers charges related to strategic stockpiles, capacity payments and energy security. It also includes taxes on natural gas distribution, stranded costs and levies for financing energy regulatory authorities or market and system operators. In 2024, Hungary and Germany had the highest capacity tax cost (EUR 0.03 per kg)
Figure 33. CNG remains relatively cheap in Poland (EUR 1.04 per kg) and Spain (EUR 1.27 per kg) in 2025
CNG prices at pump
Based on xavvy extracted on 2025-10-09
In line with the previously outlined trends, including the decline in pre-tax natural gas costs, CNG prices are stabilising in 2025. The price gap among the five leading road freight countries is also steadily narrowing.
Prices in France experienced a sharp decline between the end of 2022 and the beginning of 2024, from EUR 3.23 per kg to EUR 1.43 per kg. This has helped the French CNG fleet, which is relatively large compared to other EU countries. Despite being among the most expensive of the five countries, CNG prices in France are still favourable. CNG trucks have the lowest TCO compared to other powertrains.
Polish CNG prices increased from 2022 up to 2024, partly due to Russia cutting off gas exports in response to Poland’s refusal to pay in Russian rubles. Latest 2025 data show an opposite trend, with Poland recording the lowest CNG prices in the EU.
Electric buses and trucks are gaining momentum among alternative fuel vehicles, although they are still a small percentage of the overall fleet. BEVs accounted for 39% of the total EU alternative fleet in 2024, an increase of 381% compared to 2020. Vehicle manufacturers continue to increase their electric offerings, with new vehicles providing 500km of operational range at 40 tonnes of GCW. The level of carbon emissions reduction depends on the electricity's carbon intensity, which varies significantly within the EU. As electric vehicles cost two to three times more than their diesel counterparts, the electricity cost for charging is crucial to maintaining a competitive TCO.
Source: European Alternative Fuels Observatory extracted on 2025-10-09.
The following electricity prices are provided for a consumption band between 2,000 and 19,999MWh. For comparison, a fleet of 25 electric trucks travelling 100,000km per year would need about 5,000MWh of energy.
Figure 34. The average electricity price in the EU fell by 22% from 2023 (EUR 0.18 per kWh) to 2024 (EUR 0.14 per kWh)
Wholesale electricity prices pre-tax
Source: Eurostat (nrg_pc_205) extracted on 2025-10-09
Across five road transport countries, pre-tax electricity prices have declined in recent years, except in Germany, where the price of electricity has stayed at an all-time high of EUR 0.18 per kWh since 2023. Germany cut off its nuclear capacity in recent years, and despite its higher solar and hydro production output, its electricity production fell in 2024, creating tension in the supply-demand balance. In contrast, other countries saw an increase in their local production, leading to price decreases. In Spain and Italy, prices fell by 45% and 44%, respectively, between 2022 and 2024. Electricity prices in France, Spain and Poland were below the EU average in 2024.
Looking at electricity tax levels, the price paid by consumers includes 29% in taxes, on average, in the EU. It ranges from 6% in Malta to 50% in Poland. Interestingly, Poland applies the highest tax rate on both electricity and diesel (approximately half of the final price). On the other hand, Portugal has negative tax rates due to its negative renewable and capacity tax rates (it is removed from ‘energy and supply’ in Figure 35). Finally, network costs are being added to the electricity production price and the tax component. They make up 15% of the average EU price, ranging from 7% in Cyprus to 25% in Lithuania. In 2024, Cyprus, Germany and Hungary had the highest electricity prices in the EU.
Figure 35. In 2024, the highest wholesale electricity prices were observed in Cyprus, Germany and Hungary, with Sweden and Finland at the lower end
Wholesale electricity price components by country in 2024
Source: Eurostat (nrg_pc_205_c) extracted on 2025-10-09
Focusing on the top five road freight countries, electricity prices keep the same rankings before and after taxes, except in Poland, where the price paid by customers is above the EU average after taxes while being below the EU average before taxes. Post-tax French electricity prices also fell significantly in 2024. Among the five countries, Spain has the lowest electricity prices (diesel and natural gas prices are also very low compared to other EU countries).
Figure 36. In 2024, Germany recorded the highest post-tax electricity price at EUR 0.25 per kWh
Wholesale electricity prices post-tax
Source: Eurostat (nrg_pc_205) extracted on 2025-10-09
These electricity prices are from the perspective of depot charging (i.e. when an electric vehicle is recharged at the transport operator’s premises with its own infrastructure). They exclude the costs of building and maintaining the infrastructure. Public charging stations have different prices. They are at least double the average EU price shown in this briefing (> EUR 0.4 per kWh).
Subscribe to the IRU fuel price service and monitor weekly fuel prices across 60+ countries with historical data, a one-week forecast, and comparative insights to enhance budgeting and optimise fuel purchasing (free access for IRU members, partners and Intelligence subscribers)
Diesel pricing remains volatile depending on the geopolitical context in the main countries extracting, refining and exporting crude oil worldwide. Since late 2023, the data clearly highlights the significant impact of geopolitics in the Middle East on crude oil imports. Accounting for approximately 30% of the price at the pump (in 2024), crude oil is a key indicator of diesel’s final price.
The situation in the Middle East remains unstable and difficult to predict. The EU has been diversifying its crude oil imports, strengthening its energy resilience. It has stopped importing oil from Russia since 2023. OPEC imports have also declined. The EU has instead turned to the US, Norway and Brazil.
In late July 2025, the US announced significant sanctions on Iran. The US is also putting pressure on major importers of Russian crude oil, such as India. However, US sanctions on Venezuelan crude oil imports have eased. The International Energy Agency (IEA) suggests that these events will likely impact energy prices. The US Energy Information Administration (EIA) forecasts significant declines in the price of Brent crude per barrel in Q4 2025 and early 2026: falling from USD 71 in July 2025 to USD 59 in Q4 2025 to USD 50 in early 2026. This expected price decrease is based on OPEC+ members’ decision to increase production, as reported by OPEC in August 2025. Adding to the trend, the exchange rate EUR over USD could also add to future price reductions as the EUR went from USD 1.03 in January 2025 to USD 1.18 in September 2025, representing a 15% appreciation of EUR to USD.
HVO prices largely follow diesel pricing dynamics. It is heavily driven by supply and demand, as its sourcing from natural fats (e.g. cooking oil, vegetable oil) may be more diversified but is also limited. Therefore, its price is harder to predict as it depends on the volume of fats and oil available for transformation into HVO.
EU sanctions on Russia in response to the war in Ukraine have forced the bloc to adapt its supply model. Future developments may impact natural gas prices, ultimately influencing AdBlue, CNG and electricity prices in some countries. According to a recent World Bank analysis, European gas prices are expected to increase by 6% in 2025, before declining by 9% in 2026. However, these projections may take a different direction depending on global demand, which tends to be partially driven by weather conditions and the war in Ukraine.
Electricity prices vary greatly depending on each country’s supply chain. Countries more heavily reliant on natural gas supplies for their electricity production, such as Germany, are more vulnerable to price volatility. However, the EU’s commitment to increase its renewable energy capacity in 2025 could mitigate these price volatility risks by limiting reliance on Russian natural gas imports. Fitch ratings also predict increased demand from data centres and electric vehicles in 2026, with potential downward pressure on electricity prices.
The EU’s Emissions Trading System (ETS) is a carbon pricing system aimed at regulating greenhouse gas emissions. The new system, ETS2, which is scheduled to become operational in 2027, will cover emissions from road transport. Under ETS2, fuel suppliers will have to trade carbon allowances and are likely to pass on the extra costs to final consumers. The aim is to encourage investments in lower-emission solutions such as biofuels (e.g. HVO) and electric vehicles.
Under ETS2, allowances for fuel suppliers will gradually decrease every year, resulting in higher fuel prices at the pump. As an indicator, the expected extra ETS2 cost for diesel will be EUR 0.12 per litre in 2027, based on a recent RaboResearch study.
Additional administrative costs for the new system are also expected for fuel suppliers. However, it is difficult to forecast the financial impact of ETS2, as it will depend on the evolution of the EU fleet and its reliance on fossil fuel. Governments can also adjust their excise tax to alleviate financial pressure.
Road transport operators favour highways, as they are more efficient. With most highway managers leveraging tolls to maintain and expand their road networks, tolling represents a significant part of transport operators’ operational expenditures. For road freight operators, tolls make up 6% of the TCO in France and around 15% in Germany (excluding staff wages and overhead costs), according to the IRU Intelligence Briefing on trucks’ total cost of ownership.
Toll rates and collection schemes are evolving over time, notably due to the latest Eurovignette revision. This section provides an overview of tolling schemes in the EU and recent regulatory developments, particularly with the integration of the new CO₂ component.
Road tolls paid by heavy goods vehicles are regulated by Directive 1999/62/CE (Eurovignette) in the EU, establishing the principle that the user responsible for emissions is the one who pays. EU countries do not have to implement tolls. But when they do, it must be done according to the Eurovignette Directive.
Toll rates are based on the combination of different components: infrastructure use and external costs, air and noise pollution, and CO₂ emissions. Congestion can be tackled through rate differentiations during peak hours.
Infrastructure charges vary depending on the vehicle combination, typically defined by its GCW and number of axles. The method of rate calculations differs across countries. For example, German rates are based on GCW ranges, such as 3.5 to 7.49 tonnes, 7.5 to 12 tonnes, and so on. Other countries use vehicle categories, differentiating between trucks and buses, and sometimes further refining the classification into vehicle subcategories:
Some countries also consider the number of axles, adding another layer of granularity. This is because a higher number of axles typically corresponds to a higher authorised GCW.
Overall, the general approach is to increase infrastructure charges with both the GCW and the number of axles, reflecting the greater impact heavier vehicles have on road maintenance.
External charges relate to air and noise pollution components which are influenced by a combination of factors, including the GCW, the number of axles, and pollutant emissions, as defined by Euro standards, which currently range from 0 to VI. Euro VII is coming up soon. These standards set limits on harmful emissions such as nitrogen oxides. The greater the Euro standard number, the cleaner the vehicle, resulting in lower external charges.
However, even at the same Euro standard level, heavier vehicles tend to incur greater external charges due to their impact. Figure 37 illustrates the tolling cost structure for a Euro VI Class 1 T2S3 truck in Germany, showing the split between infrastructure, external costs (air and noise pollution) and CO₂ emissions.
Figure 37. Toll fees consist of infrastructure charges, air and noise pollution costs, and CO₂ emission costs
Toll fees in Germany for Euro VI class 1 (T2S3)
Source: IRU estimates extracted on 2025-10-09
Finally, the latest Eurovignette revision (Directive (EU) 2022/362) requires EU countries to add a CO₂ component to their external charges, differentiating vehicles based on their CO₂ emissions performance. There are five CO₂ emission classes, with class 1 being the worst and class 5 being the best:
Only trucks registered after July 2019 with a GVW above 16 tonnes, two or three axles, including only one driven axle, can belong to classes 2 to 4. This is due to the EU database built around the VECTO software, which currently only considers these vehicles. However, this will change in the future as more vehicle configurations are taken into account. All trucks and buses can belong to class 5 if they are equipped with only an electric or hydrogen powertrain.
Across the EU, there are three main road user charge collection schemes for road transport:
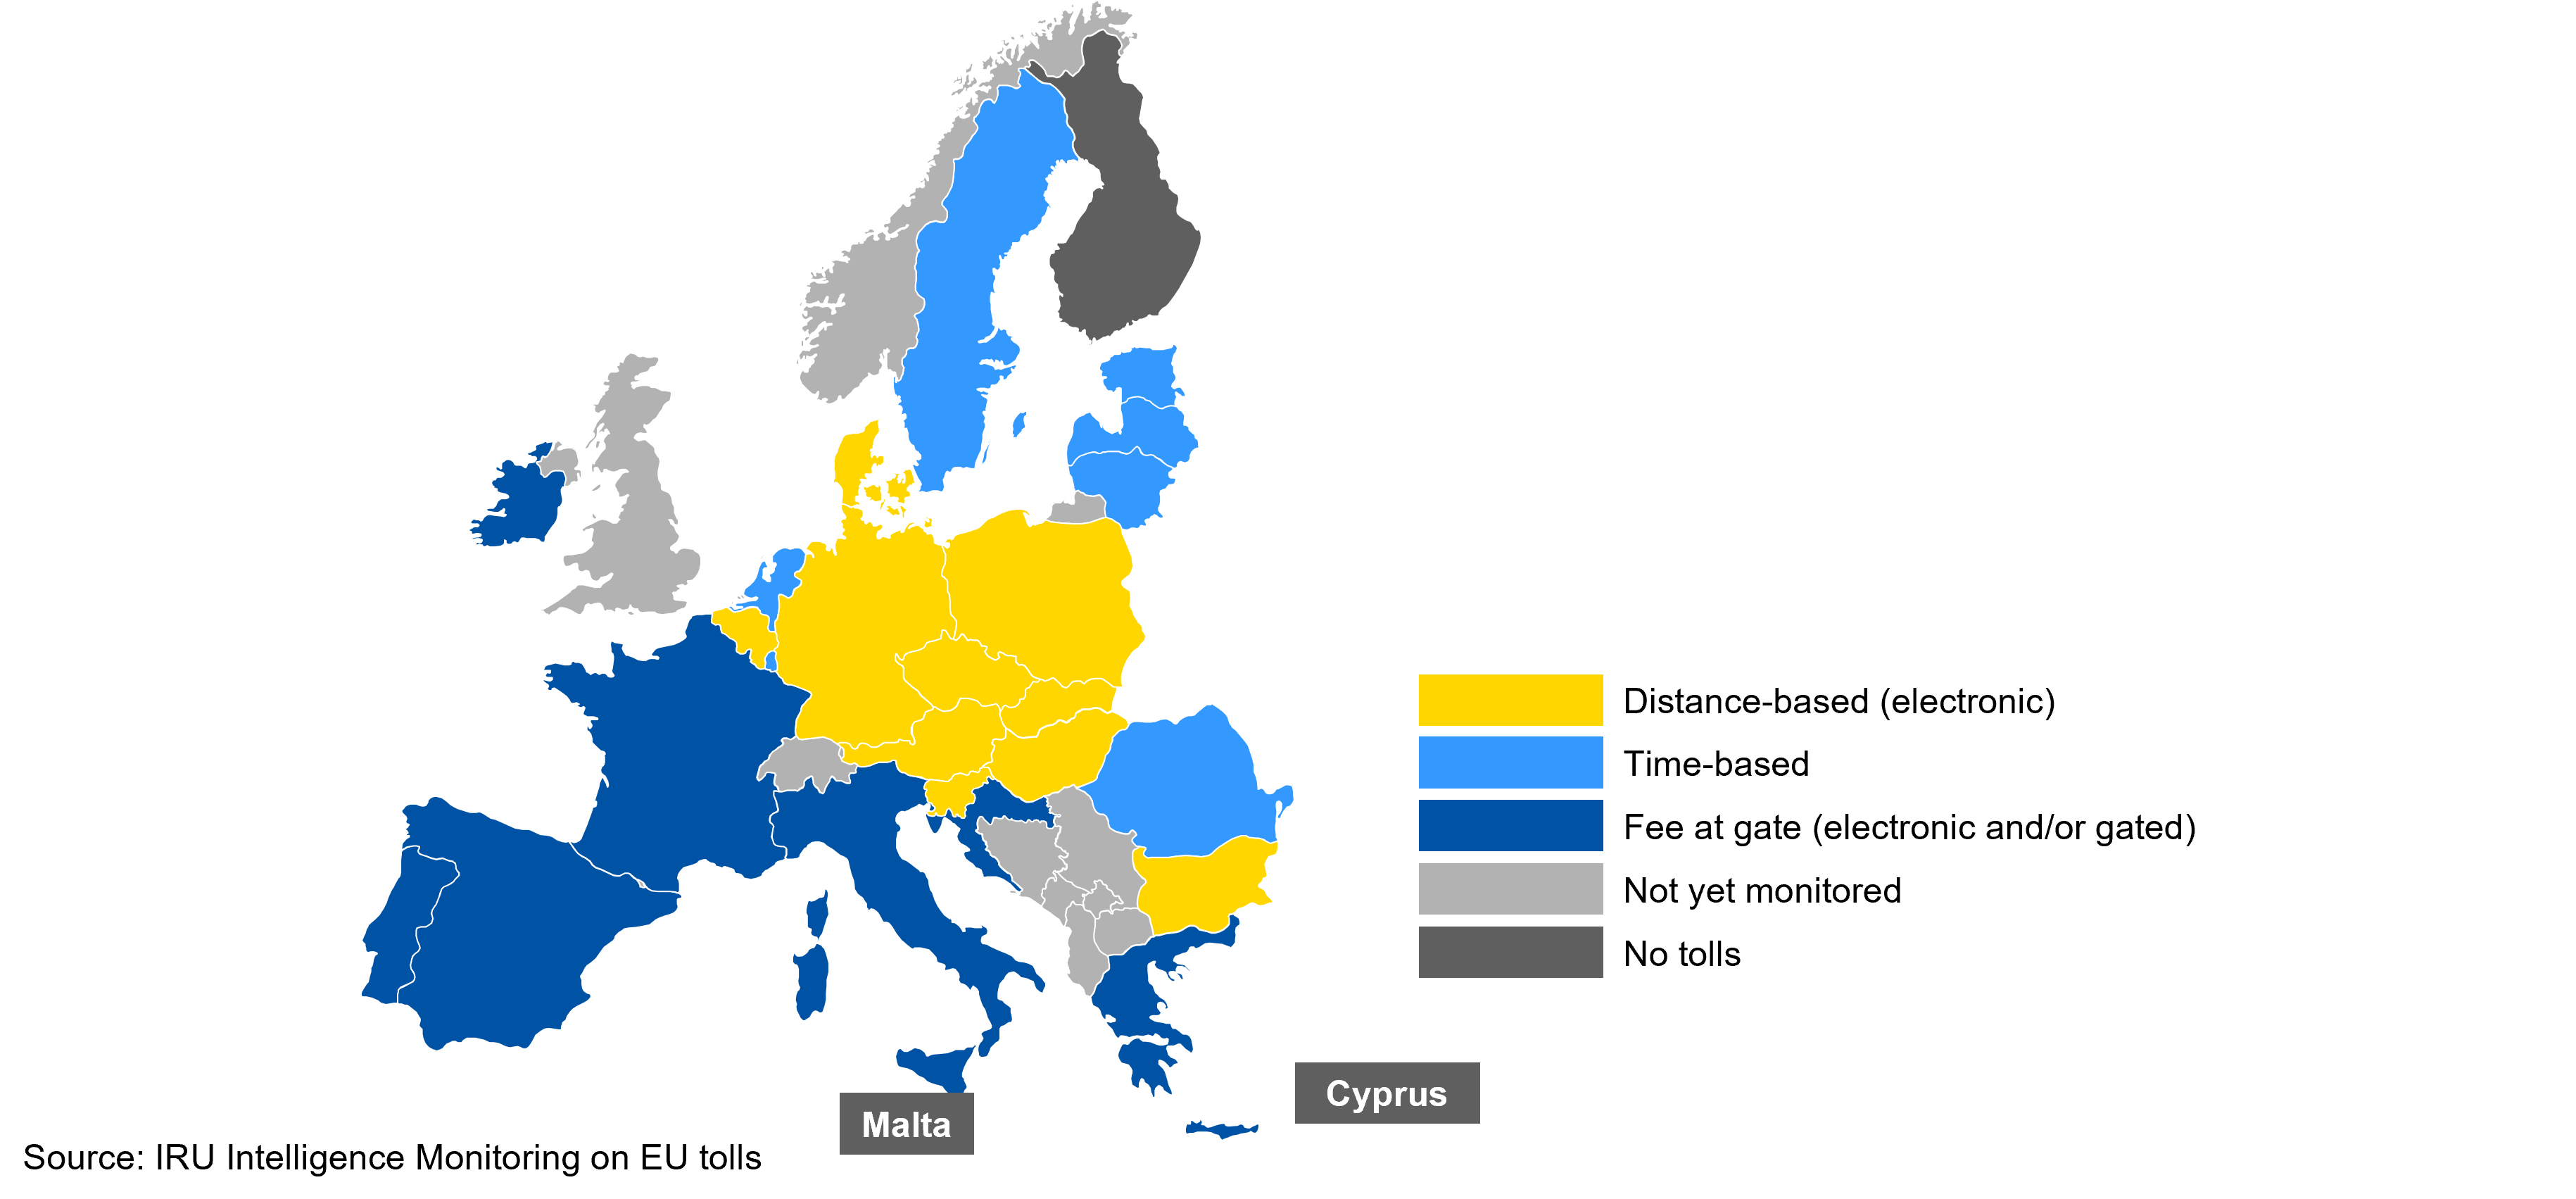
Figure 38 maps the current tolling schemes in use across the EU for trucks. The Netherlands plans to introduce a distance-based system in 2026. The situation differs for buses, which are usually exempt from toll charges, as in Germany.
Figure 38. Most EU countries have either a distance-based or gated toll system
Toll status by scheme in EU (as of August 2025)
Source: IRU estimates extracted on 2025-10-09
The following section focuses on toll rates applied only to trucks, as most EU countries do not charge buses and coaches.
Each EU country can set its own toll rates, leading to a variety of fees across the bloc. Islands such as Malta and Cyprus do not have tolls for trucks. Finland is the only country in continental Europe to not have tolls for trucks. Belgium, Denmark, Estonia, Germany, the Netherlands and Sweden do not charge buses.
Figure 39 illustrates the distribution of toll fees for trucks across the EU, at the date of publishing. Rates range from EUR 1.48 per kilometre in Hungary for the largest Euro 0 truck to EUR 0.032 per kilometre for countries in the Eurovignette zone (Luxembourg, the Netherlands and Sweden, assuming a truck travels 75,000km annually which is subject to tolls within that country) in 2025. It should be noted that some trucks are exempted from toll fees, notably ZEVs in Germany. More information is provided in the next section.
Figure 39 uses box plots to illustrate toll rates across the EU. Given the diversity and complexity of tolling schemes within the EU, box plots are well suited to highlight median values and the range of price variation, which depend on vehicle characteristics, as previously described.
A box plot (also known as a box-and-whisker plot) is a graphical representation used to show the distribution of a data set. It provides a visual summary of the data’s central tendency, variability and skewness. Its key components are:
Countries with distance-based tolling systems tend to have higher per-kilometre charges, such as in Austria, Germany and Hungary. In contrast, countries using time-based vignette systems, including Luxembourg, the Netherlands and Romania, report significantly lower effective toll rates per kilometre, often not proportional to road usage or emissions. For instance, Germany’s median toll fee is EUR 0.302 per km, while in Luxembourg and the Netherlands, it is about EUR 0.016 per km (assuming 75,000km travelled annually by a truck subject to the toll within that country).
Figure 39. Toll rates range from zero to EUR 1.48 per km in the EU
Toll fee distribution by country in 2025
Source: IRU estimates extracted on 2025-10-09
Focusing now on Euro VI class 1 T2S3 articulated vehicles, the most used combination in the EU, Figure 40 compares toll prices and fuel intensity across the bloc. Austria, Hungary and Germany are the only countries where operators pay more per kilometre for tolls than fuel. Austria has the highest toll rate at EUR 0.62 per km, and a fuel intensity of EUR 0.46 per km, adding up to nearly EUR 1.08 per km. Luxembourg has the lowest total cost per kilometre, with a fuel intensity of EUR 0.43 per km and a toll rate of EUR 0.014 per km, adding up to EUR 0.4314 per km. This overall low sum is due to its time-based tolling fee, which, as shown previously, results in a lower per kilometre cost than a distance-based system.
It should also be noted that all EU countries have relatively similar fuel prices, indicating a somewhat uniform diesel price. Interestingly, despite having a distance-based system, Poland has a lower overall toll fee than Austria and Hungary.
Figure 40. Toll fees exceed fuel prices in only three EU countries
Toll and fuel cost by country in 2025 (for a Euro VI class 1 T2S3 truck)
Source: IRU estimates & xavvy extracted on 2025-10-09
Some countries share the breakdown of their toll rates. Among distance-based countries, only data from Hungary and Germany can be used in the next sections. Both countries’ toll systems have a CO₂ component.
Figures 41 and 42 present the toll cost breakdown for a 5-axle truck in Germany and Hungary in 2025, across different Euro standards. These figures highlight the relative contribution of each cost component, namely CO₂ pricing, infrastructure charges, and environmental surcharges, demonstrating how cleaner vehicles have substantially lower fees.
For example, Euro 0 trucks incur a tolling cost of EUR 1.48 per km in Hungary, whereas ZEVs pay around EUR 0.57 per km. For Euro 0 vehicles, approximately 55% of the toll fee is attributed to air and noise pollution charges, while for ZEVs, over 91% of the cost relates to infrastructure usage, highlighting the heavier financial burden placed on more polluting vehicles. The rate of toll reduction varies across Euro norm upgrades. Transitioning from Euro IV to Euro VI results in a 28% reduction in toll costs, while the shift from Euro VI to ZEVs yields only a 20% reduction. This pricing structure is designed to incentivise operators of the most polluting vehicles to upgrade, even if not directly to ZEVs, but at least to significantly cleaner alternatives.
Figure 41. More than 70% of Hungary’s tolling costs stem from infrastructure charges
Toll fee breakdown in Hungary in 2025 (for a class 1 T2S3 truck)
Source: IRU estimates extracted on 2025-10-09
In Germany, Euro 0 and Euro I trucks pay EUR 0.51 per km, while Euro VI CO₂ class emission 5 vehicles pay nothing. For Euro 0 and Euro I trucks, air and noise pollution and CO₂ emission costs amount to EUR 0.20 per km, or 39% of the total fee, while this falls to EUR 0.04 per km, or 13% of the total fee, for Euro VI CO₂ class 4 trucks. This is driven by lower CO₂ and NOx emissions from better trucks.
Figure 42. German tolling fees are evenly split among CO₂ emissions and infrastructure charges, each accounting for 45%, for a Euro VI class 1 truck
Toll fee breakdown in Germany in 2025 (for a T2S3 truck)
Source: IRU estimates extracted on 2025-10-09
Fleet composition is an important variable in determining how operators experience these costs. In 2024, Euro V or older trucks transported 17% of total road freight volumes moved by Hungary’s fleet, compared to less than 4% for Germany. Hungarian operators are therefore disproportionately exposed to higher toll charges when operating in countries with a stronger differentiation based on Euro standards. This link between the fleet renewal pace and the toll exposure could be further supported with additional examples (e.g. comparing Poland’s share of older vehicles against its relatively lower tolling costs).
Figure 43. Euro V and older trucks account for 4% of the total road freight volume moved by the German fleet
Share of road freight volume by emission standard of operational trucks in Germany in 2024
Figure 44. Euro V and older trucks account for 18% of the total road freight volume moved by the Hungarian fleet
Share of road freight volume by emission standard of operational trucks in Hungary in 2024
Source: Eurostat (road_go_ta_agev) extracted on 2025-10-09
At the EU level, a clear downward trend in tolling costs is evident: median fees decline from EUR 0.21 per km for Euro 0–IV trucks, to EUR 0.15 per km for Euro IV–V, and further to EUR 0.10 per km for Euro VI vehicles. Notably, the marginal cost savings increase with each successive upgrade. For example, moving from Euro 0–IV to Euro IV–V results in a 29% reduction, while upgrading from Euro VI to ZEV/LEV yields a 64% decrease in median tolls, almost twice as more for improving Euro norm (please note that these are only averages and might change depending on country, type of vehicle, its GCW, etc.). This structure strongly incentivises fleet renewal, even if a full transition to ZEVs is not yet feasible.
Cross-country comparisons reinforce these findings. Countries with distance-based or CO₂-adjusted systems, such as in Germany, Austria and Czechia, show sharp cost differentiation between Euro and CO₂ classes. By contrast, time-based vignette systems produce uniformly low tolls with only minor discounts for cleaner trucks. For example, a Euro IV–V truck pays around EUR 0.12 per km, compared to EUR 0.032 per km for ZEVs/LEVs, a 74% reduction, but from a much lower base than in distance-based systems.
Figure 45. On average, tolls amount to EUR 0.10 per km for Euro VI trucks in the EU, but only EUR 0.036 for ZEVs/LEVs, representing a 64% lower toll rate
Toll fee by Euro norm in EU in 2025
Source: IRU estimates extracted on 2025-10-09
Further analysis of tolling fees across countries with a CO₂ component reveals notable patterns. In countries applying time-based vignettes, overall costs remain low. Conversely, distance-based tolling systems create a direct economic benefit for trucks with improved emission profiles, reducing tolling costs for lower emitters. For example, the median toll rate for a CO₂ class 1 truck stands at EUR 0.07 per km in Czechia, while for a class 5 ZEV, it drops to EUR 0.036 per km, representing a 49% reduction. In Germany, CO₂ class 5 ZEVs do not pay tolls. IRU TCO calculations have found that such toll rate differentiations between class 1 and 5 are making the operation of BEVs cheaper than diesel vehicles in Germany.
Figure 46. Austrian tolls range from EUR 0.73 per km for CO₂ class 1 vehicles to EUR 0.14 per km for CO₂ class 5 vehicles
Toll fee by country and CO₂ emission class in 2025
Source: IRU estimates extracted on 2025-10-09
In addition to Euro emission standards and CO₂ classes, the axle configuration and GCW also play a significant role in determining toll rates. This reflects the varying degrees of infrastructure wear and tear caused by different vehicle types, with heavier vehicles imposing greater strain on road networks.
As shown in the figures below, tolling costs clearly rise with the number of axles and total weight. For example, trucks with four or more axles face a median toll of EUR 0.19 per km across the EU, compared to just EUR 0.13 per km for those with only two to three axles. A similar pattern is evident for GCW classifications: N2 trucks (up to 12 tonnes) incur a median toll of EUR 0.035 per km, whereas N3 trucks (over 12 tonnes) reach nearly EUR 0.13 per km. This cost structure reinforces the "user pays" principle, aligning tolls with infrastructure impact and encouraging the use of lighter, more road-friendly vehicles, particularly for short-haul or urban routes where such configurations are viable.
Figure 47. Trucks with four or more axles pay about 46% more in tolls (EUR 0.19 per km) than those with two or three axles (EUR 0.13 per km)
Toll fee by axle type in EU in 2025
Source: IRU estimates extracted on 2025-10-09
Figure 48. On average, toll rates rise from EUR 0.035 per km for N2 vehicles to EUR 0.13 per km for N3 ones
Toll fee by type of truck in EU in 2025
Source: IRU estimates extracted on 2025-10-09
To conclude, tolling costs are shaped by a combination of distance-based, time-based and mixed collection schemes in the EU. Distance-based systems generally impose higher per-kilometre charges. This creates strong contrasts. For example, median tolls in Germany are around EUR 0.3 per km, compared to only EUR 0.016 per km in Luxembourg under a vignette regime.
At the same time, regulatory reforms such as the Eurovignette revision are embedding new CO₂ components alongside existing Euro standards, axle counts and GCW thresholds. This has already produced significant differentiation: in Hungary, Euro 0 trucks pay nearly three times more per kilometre than ZEVs, while in Germany, class 5 vehicles are fully exempted from tolls.
Together, these developments show that tolls have become a decisive factor in operational costs, accounting for up to 15% of trucks’ TCO in some markets. As charges are increasingly tied to both infrastructure wear and environmental performance, operators will need to adapt their fleet strategies to both minimise fuel use and ensure cost-effective compliance with tolling regimes that are now central to competitiveness across the EU.
Rates are evolving every year, with recent years resulting in significant rate increases for trucks in particular. The largest toll increase has taken place in Denmark, rising by 500% following a switch from a time-based to a distance-based system. The Netherlands is expected to start applying a distance-based tolling scheme in July 2026, which could significantly increase rates.
Figure 49. In Denmark, the change to a time-based tolling scheme has increased the tolling fee by 500%
Toll increase by country for a Euro VI class 1 T2S3 truck (2024 – 2025)
Source: IRU estimates extracted on 2025-10-09
Figure 50 zooms in on toll fee changes for other countries (it excludes Denmark). Slovakia recorded the highest year-on-year toll increases at nearly 45%, while in some countries it rose by 5%. In Latvia, toll fees declined by 1.5%.
Figure 50: Toll fees climbed by nearly 45% year on year in Slovakia
Toll increase by country for a Euro VI class 1 T2S3 truck (2024 – 2025)
Source: IRU estimates extracted on 2025-10-09
One of the biggest reasons behind the latest toll increases is the revision of the Eurovignette Directive, which requires all EU countries to add a CO₂ component. Now in force in nine EU countries, the implementation has increased the price for Euro VI Class 1 articulated vehicles from 2% to 83% (in Germany).
Figure 51. In Germany, the implementation of the CO₂ component increased the tolling fee by 83%
Toll increase for countries which added a CO₂ component (for a EURO VI class 1 T2S3 truck)
Source: IRU estimates extracted on 2025-10-09
Figure 52. Nine countries have, or are in the process of, implementing a CO₂ component
Status of CO₂ component implementation in EU as of August 2025
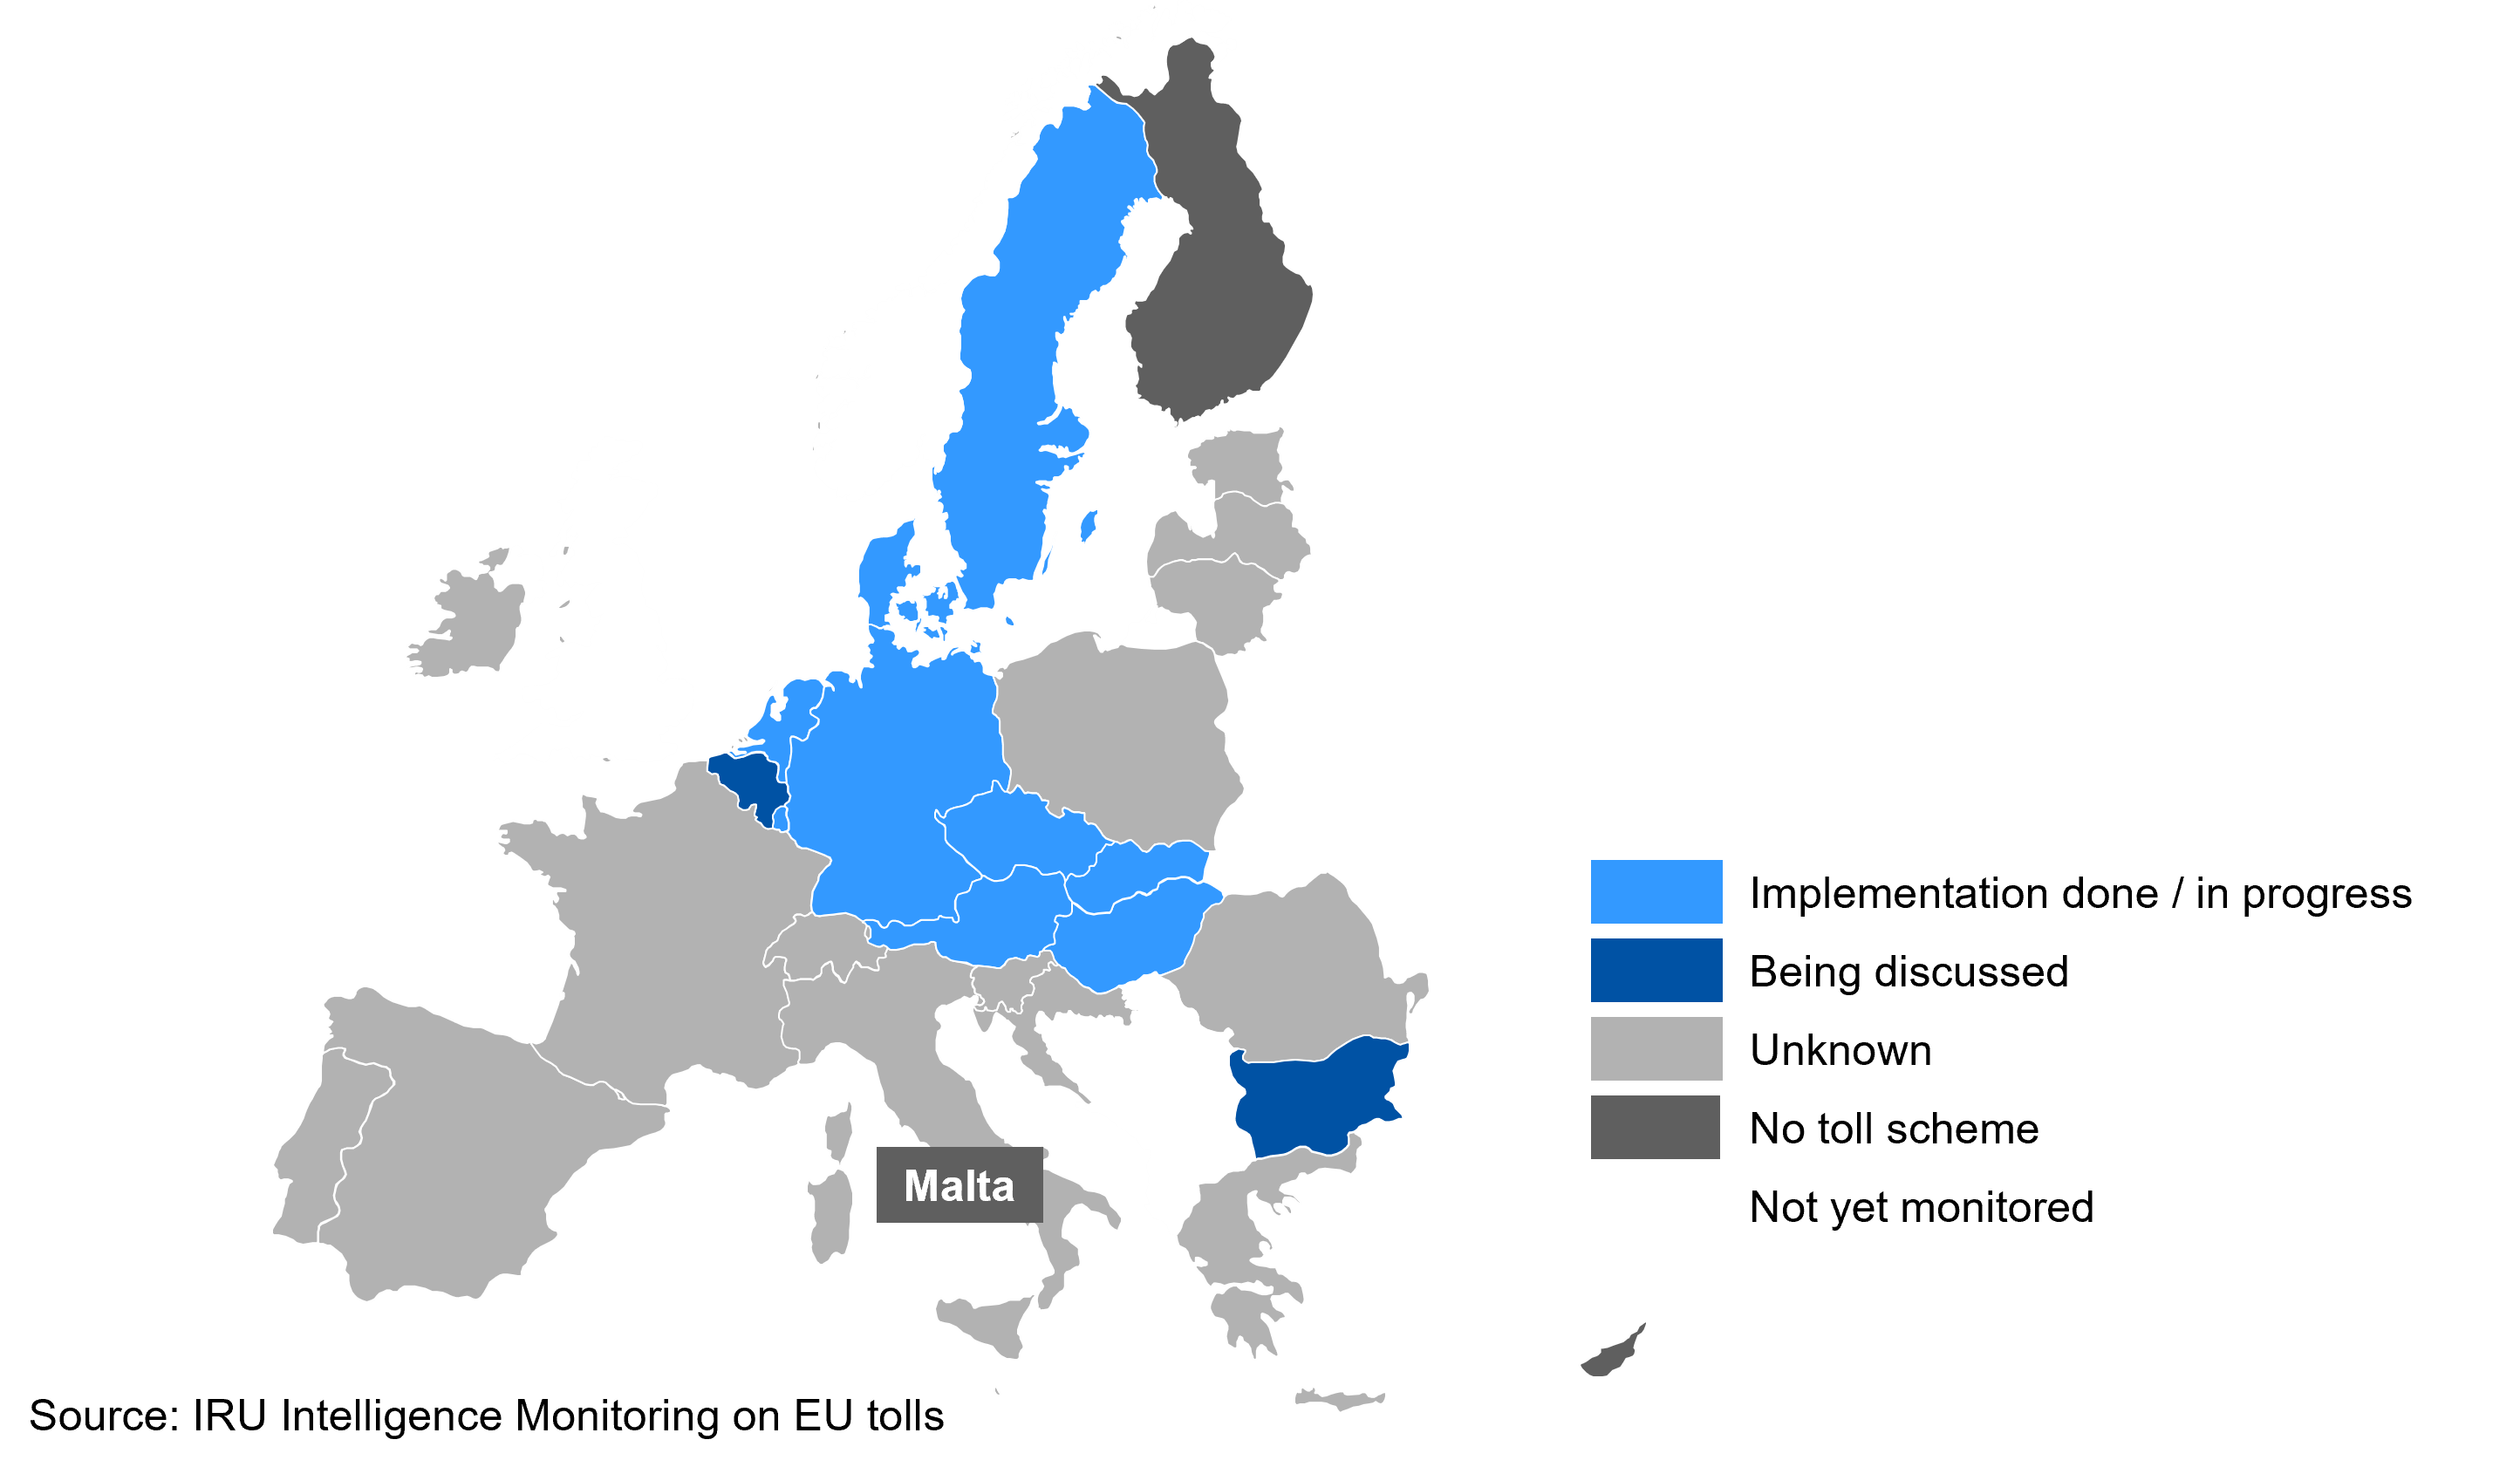
The greatest increase occurred in Germany in December 2023, when the authorities set a carbon price of EUR 200 per tonne, adding EUR 0.158 per km to the previous EUR 0.19 per km rate. Not all prices went up. Class 5 vehicles, or ZEVs, are fully exempt from tolls until the end of 2025. In 2026, rates for class 5 vehicles will still be lower than other classes. They will only have to pay 25% of the infrastructure component plus a partial part of the external costs.
In the countries listed in Figure 53, ZEV tolls are either fully exempt or significantly reduced. In Austria, a CO₂ emission class 5 ZEV truck with four or more axles pays EUR 0.12 per km, whereas a Euro VI diesel truck with CO₂ class 1 pays EUR 0.53 per km. This represents an 77% reduction in toll costs for ZEVs, providing a strong financial incentive for operators to purchase and operate zero-emission technologies.
Figure 53. In Europe, three countries fully exempt ZEVs from tolls, while eleven offer reduced toll rates
Toll exemption status in Europe as of August 2025
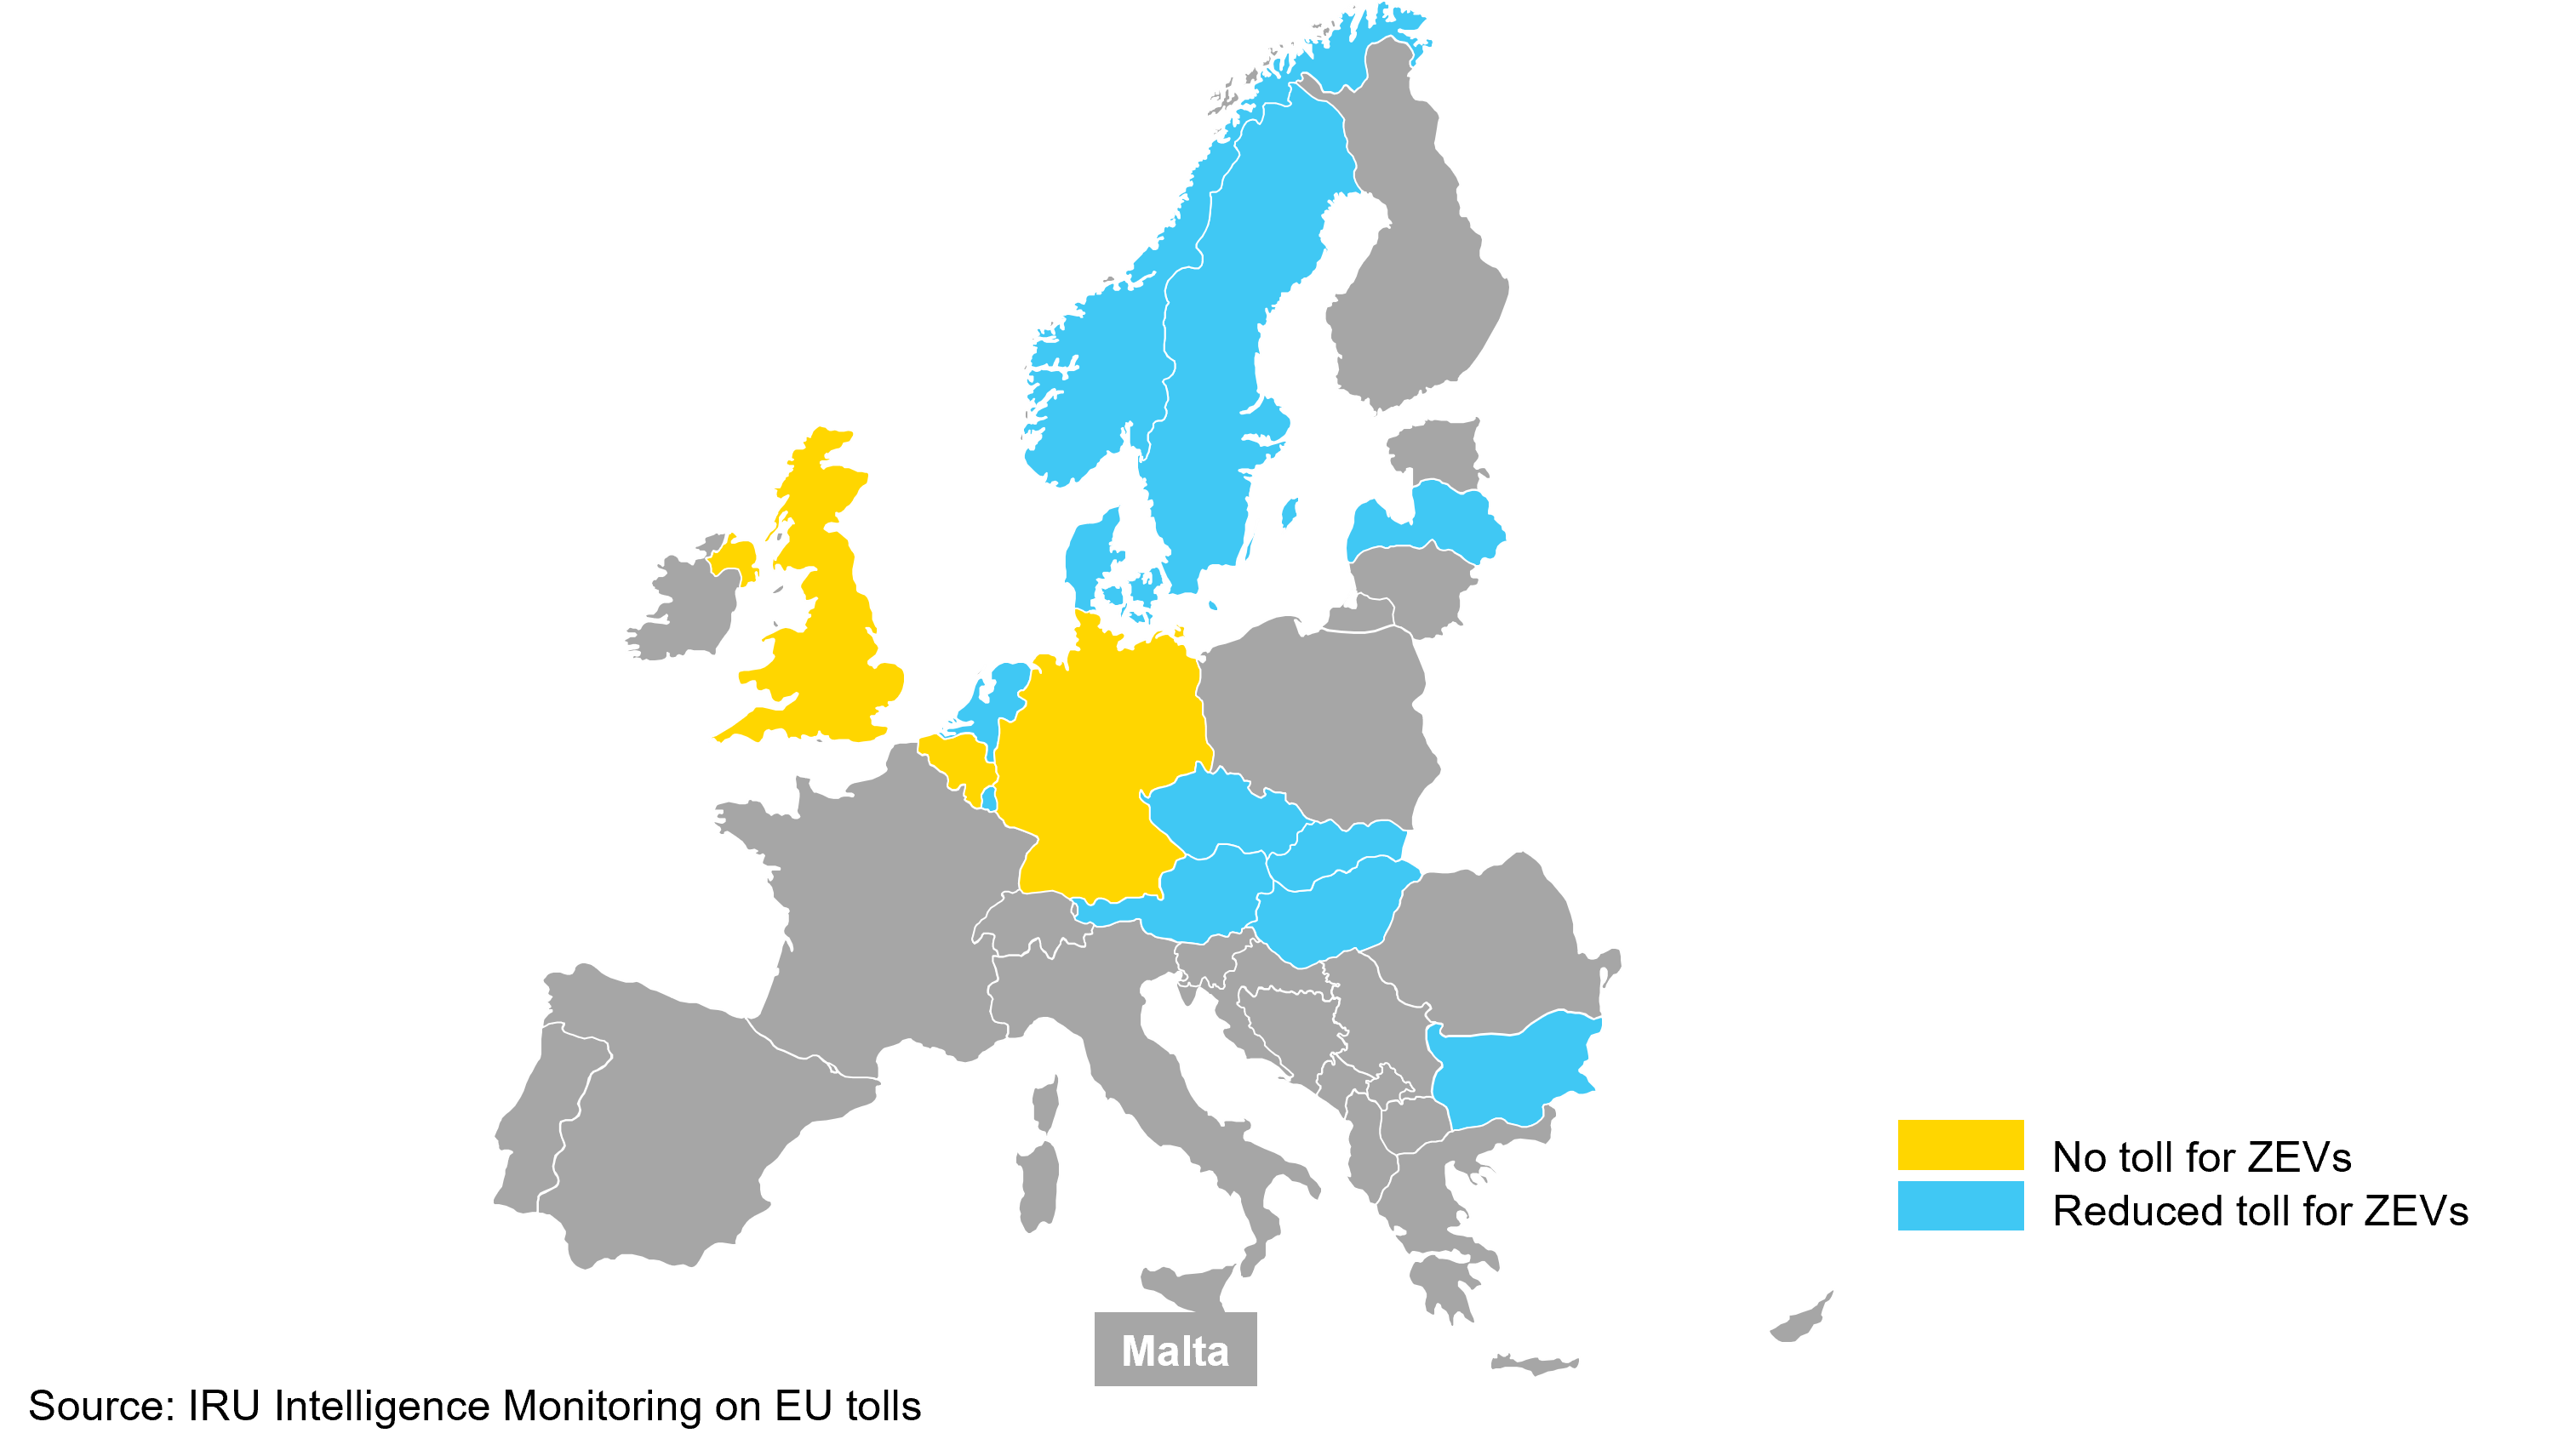
Inflation has also contributed to the increase in toll rates. Some countries, including Belgium and Hungary, now index their toll rates to inflation. Slovakia has also increased its toll rates significantly by adding a CO₂ component, which has been compounded by an increase in VAT. The change from time-based to distance-based has also contributed, just like in Denmark.
Fuel and tolls represent a significant share of the TCO, though their share varies widely by country. In today’s economic climate, understanding these cost drivers is essential for planning, sustainability and competitiveness.
Diesel remains the dominant powertrain (99% of trucks and 93% of buses in 2024), while some fleets have biodiesel blends with HVO and FAME. The EU's 2050 zero-emission target has accelerated the adoption of alternative fuel vehicles. CNG and electric vehicles account for 49% and 9%, respectively, of the EU’s alternative fleet.
Fleet composition varies by country. France has a high proportion of CNG vehicles, whereas Germany favours electric vehicles, influenced by subsidies, infrastructure and fuel prices. Operators are increasingly adopting HVO100, the pure form of HVO, to reduce emissions while minimising cost increases.
Figure 54. Fuel prices in France, Italy and Spain fell year on year between 2023 and 2024
OpEx dynamics by country (2023 – 2024)
Source: IRU estimates & Eurostat (nrg_pc_205) & xavvy extracted on 2025-10-09
The price of diesel at the pump consists of three key components: raw material costs (crude oil), refinery and distribution costs, and taxes. The EU relies heavily on crude oil imports to meet its demand, as its domestic extraction is relatively low (0.3% of global output in 2024). Most EU crude oil imports originate from OPEC countries (26%), followed by the US (15%) and Norway (14%). The EU's large refinery capacity, the third largest behind North America and Asia Pacific, has helped increase its production level in recent years to 60%. This trend highlights the EU's shift towards energy independence, mitigating its vulnerability to price fluctuations.
Crude oil prices have fluctuated significantly due to geopolitical developments and changing demand patterns. A sharp rise occurred between 2020 and 2023, coinciding with the post-pandemic freight recovery. More recently, conflict in the Middle East has triggered short-term price increases. Government-imposed excise taxes and VAT also have a significant influence on the final price at the pump. Spain and Poland have relatively low diesel prices (EUR 1.40 per litre and EUR 1.42 per litre, respectively, in August 2025), largely because of their lower tax rates. Italy, however, has higher diesel prices (EUR 1.65 per litre) due to its more substantial tax margin.
HVO prices across the 11 EU countries that report it (Austria, Belgium, Czechia, Denmark, Estonia, Germany, Italy, Luxembourg, Netherlands, Spain, Sweden) averaged EUR 1.93 per litre in August 2025, approximately 22% higher than diesel (EUR 1.58 per litre). AdBlue (used in diesel and HVO vehicles) and CNG prices depend on natural gas prices. EU natural gas imports have diversified since 2022, with the US, Norway and intra-EU becoming much larger suppliers. This diversification has helped lower the pre-tax price in recent years. CNG prices at the pump are consistently lower in Spain (EUR 1.27 per kg in August 2025), Germany (EUR 1.49) and Italy (EUR 1.42) compared to the EU average (EUR 1.69).
Electricity prices vary significantly across the EU, primarily due to different energy sourcing strategies. Countries with self-sufficient, cost-effective electricity production, such as France with its nuclear infrastructure, enjoy lower electricity prices. In contrast, countries like Germany that depend more heavily on fossil fuels and imported renewables have higher electricity prices. Taxation also significantly impacts the final price. In 2024, electricity taxes represented about 29% of the wholesale price in Germany and 49% in Poland, contributing substantially to their elevated retail electricity prices.
Tolling represents a significant component of the TCO (15% for trucks in the EU). Distance-based systems such as in Austria, Germany and Hungary impose the highest charges, while time-based schemes in countries like Luxembourg keep rates very low. The new Eurovignette revision requiring the embedding of a CO₂ component has led to sharp cost gaps: in Austria, tolls range from EUR 0.74 per km for CO₂ class 1 trucks down to EUR 0.14 per km for class 5 ZEVs, while Germany is exempting ZEVs until 2026.
Older fleets are heavily exposed. Euro V or older trucks still cover 17% of Hungary’s road freight fleet’s compared with just 4% in Germany, driving up costs in countries with strong emission differentiation classes. Recent tolling scheme reforms have triggered price increases, from Denmark’s 500% jump after shifting to a distance-based system to Germany’s 83% increase with the addition of a CO₂ component. With 13 EU countries now granting toll exemptions or discounts for ZEVs, tolling is a strategic lever for fleet renewal and competitiveness.
Understand and explore the issues driving change in mobility and logistics with our industry and market intelligence reports. Harness the collective knowledge of our members and receive live updates on regulatory, market and operational issues.